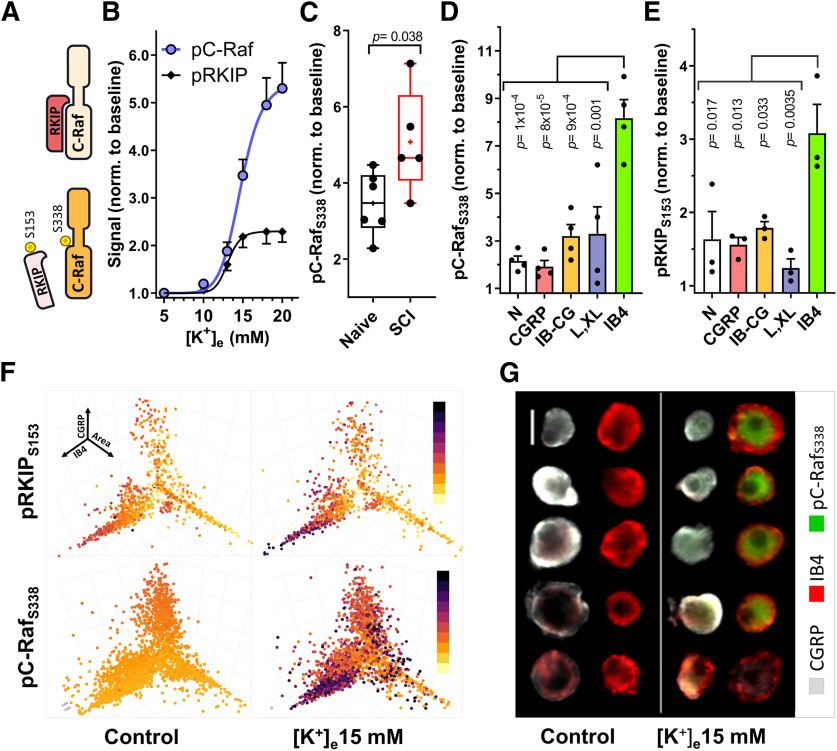
Figure 5.
Depolarization induces C-Raf activation and relief of RKIP inhibition in IB4+ neurons. A, C-Raf activity is promoted by phosphorylation (S338). C-Raf inhibition is relieved on phosphorylation of RKIP (S153). B, Phosphorylation of C-Raf (S338) and RKIP (S153) in response to increasing [K+]e (5 min stimulation). pC-RafS338, n = 3-7; pRKIPS153, n = 3. C, Phosphorylation of C-Raf (S338) with 15 mm [K+]e in naive and SCI DRG neurons; Naive, n = 6; SCI, n = 5. Data compared via unpaired t test. Box-and-whisker plot represents the median, mean (+), quartiles, and range of the data. D, E, Quantification of pC-Rafs338 (D, n = 4) and pRKIPS153 (E, n = 3) phosphorylation in naive neurons in response to 5 min, 15 mm [K+]e between different neuronal subpopulations (cluster analysis performed as in Fig. 2). Differences in cluster responses determined via one-way ANOVA, followed by Tukey's test. pC-RafS338 and pRKIPS153 responses have been normalized to control baselines for each cluster. p values in the figure correspond to the comparison against IB4. Detailed statistical information is provided in Table 1. F, C-Raf and RKIP phosphorylation in control and 15 mm [K+]e, shown as coordinates of nociceptor Area (X), CGRP (Y), and IB4 (Z) intensity. Dot color saturation is proportional to the intensity of fluorescent signal. Darker colors represent stronger signals. pRKIP: n > 1000 neurons; pC-Raf: n > 3200 neurons. G, Examples of pC-RafS338 responses to depolarization (5 min, 15 mm [K+]e). 10× magnification. Scale bar, 25 μm.

