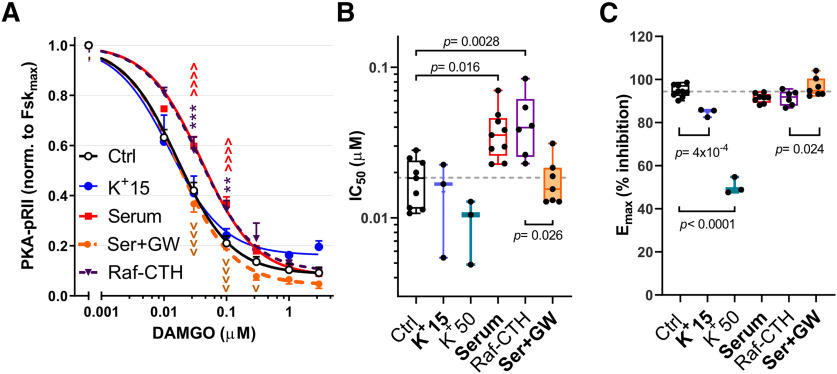
Figure 6.
Effects of depolarization and C-Raf activation on HEK-293MOR cells. A, DAMGO dose–response curves in control conditions ([K+]e 5 mm, serum-starved; black empty circles), [K+]e 15 mm (blue circles), C-Raf-CTH overexpression (Raf-CTH; purple triangles, dotted line), serum treatment (not starved, red squares), or serum in presence of 3 μm the C-Raf inhibitor GW5074 (Ser+GW; orange circles, dotted line). Control, n = 7-9; K+15, n = 3; Serum, n = 3-11; Raf-CTH, n = 6; Ser+GW, n = 7 or 8 per data point. Treatment effects were compared via two-way ANOVA, followed by Sidak's test. vp < 0.05; **p < 0.01; ***p < 0.001; ∧∧∧∧,vvvvp < 0.0001. *Control versus Raf-CTH. ∧Control versus Serum. vSerum versus Ser+GW. B, C, Effects of the different treatments used in A, on DAMGO IC50 (B) and Emax (C); 50 mm K+ not shown in A. B, Control, n = 9; K+15, n = 3; K+50, n = 3; Ser, n = 9; Raf-CTH, n = 6; Ser+GW, n = 7. C, Control, n = 9; K+15, n = 3; K+50, n = 3; Ser, n = 8; Raf-CTH, n = 6; Ser+GW, n = 7. Treatment effects compared via one-way ANOVA followed by Dunnett's test. Box-and-whisker plot represents the median, mean (+), quartiles, and range of the data. Detailed statistical information is provided in Table 1.

