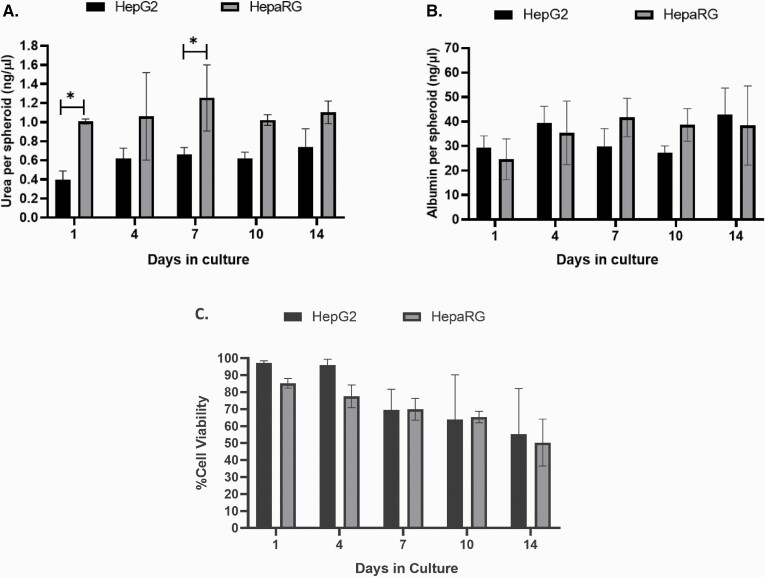
Fig. 2.
Characterisation of HepG2 and HepaRG liver cells over 14 days in culture. (A) Urea and (B) albumin production and (C) viability of 3D HepG2 and HepaRG spheroids were evaluated over 14 days. Statistical differences between HepG2 and HepaRG spheroids were analysed using two-way ANOVA with Bonferroni post hoc (*P < 0.05). Data shown are expressed as mean ± SD, n = 3.

