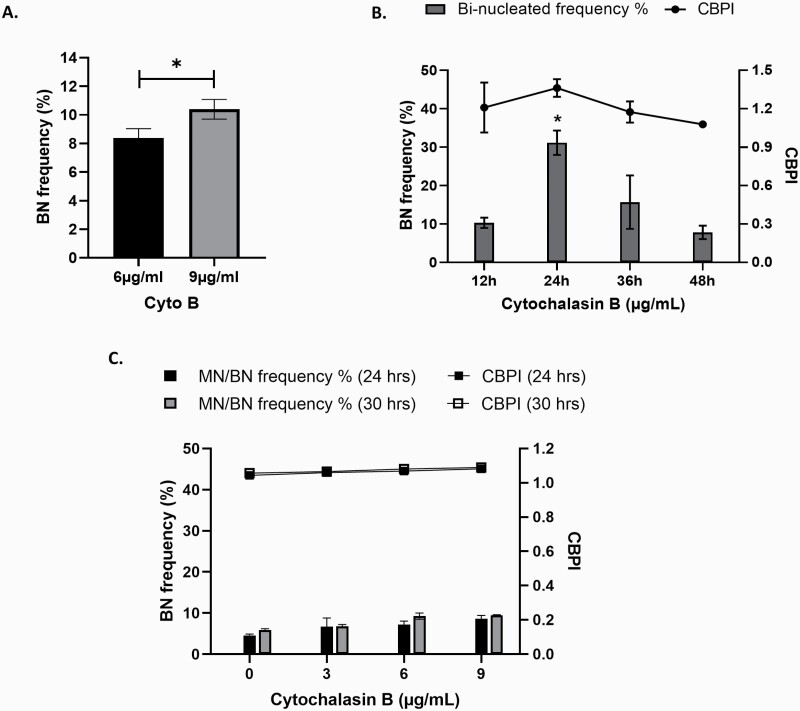
Fig. 3.
Optimisation of Cyto B application for use with the CBMN assay. HepG2 3D liver spheroids were exposed to (A) 6 and 9 µg/ml Cyto B for 24 h and (B) 6 µg/ml Cyto B for 12, 24, 36 and 48 h and analysed for percentage BN cell frequency. Statistical differences were analysed using (A) unpaired t-test (*P = 0.021) and (B) one-way ANOVA with Bonferroni post hoc (*P < 0.01). (C) HepaRG spheroids were exposed to increasing concentrations of Cyto B (3, 6 and 9 µg/ml) for 24 and 30 h and analysed for percentage BN cell frequency and CBPI. Data shown are expressed as mean ± SD, n = 2.

