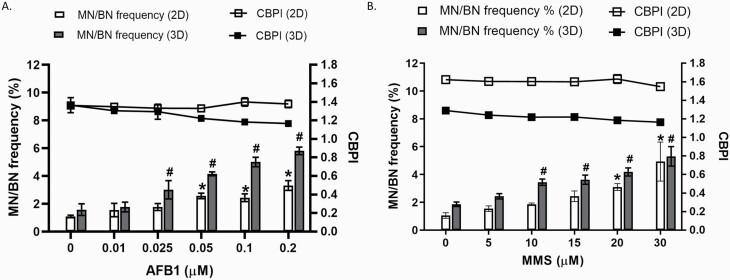
Fig. 4.
Assessment of micronuclei frequency in 2D monocultures and 3D HepG2 spheroids following a genotoxic insult. 2D HepG2 monocultures and 3D spheroids were exposed to increasing concentrations of (A) Aflatoxin B1 (0–0.2 µM) and (B) MMS (0–30 µM) for 24 h and analysed for MN in BN cells (MN/BN%) and CBPI. Statistical significance was compared to the untreated control and was analysed by one-way ANOVA with Bonferroni post hoc (*P < 0.007). Data shown are expressed as mean ± SD, n = 3.

