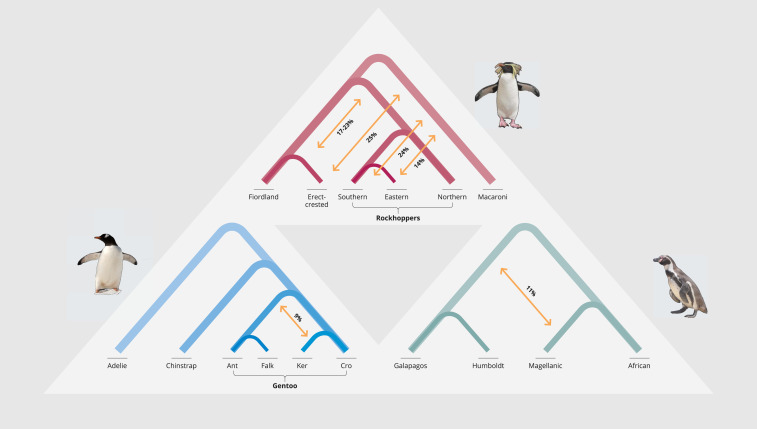
Fig. 2.
Summary of the main introgression episodes among penguin taxa. Arrows represent the percentage of introgression between taxa for all eight combinations of the five taxon statements evaluated. Only episodes involving >2% introgression are shown. More details, including additional signatures of introgression, are provided in SI Appendix, Fig. S9 and Table S7. Species are identified by their common names (and sampled populations in the case of gentoo penguins); see Fig. 1 for correspondence to genus names.

