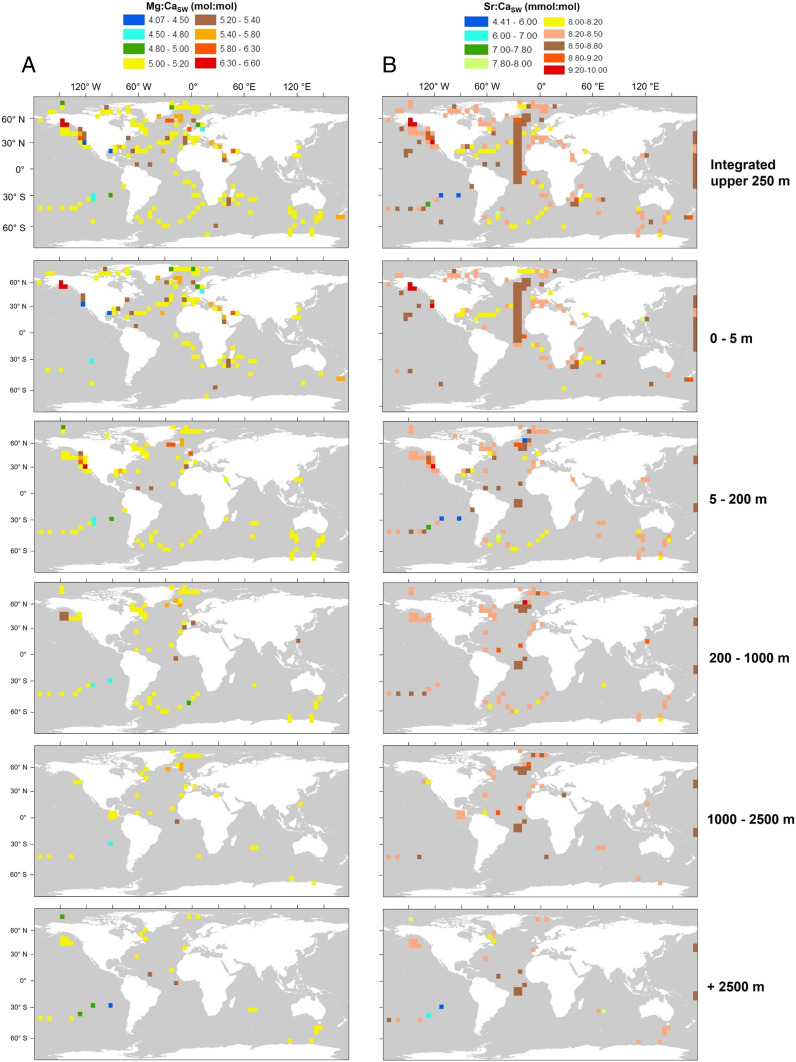
Fig. 1.
Modern ocean global variability in seawater Mg:Ca and Sr:Ca ratios. Averaged global seawater Mg:Ca (A) and Sr:Ca (B) ratios from the upper 250 m and separated in five depth intervals (0 to 5 m, 5 to 200 m, 200 to 1,000 m, 1,000 to 2,500 m, and +2,500 m), overlaid in 5° × 5° latitude/longitude quadrats (see SI Appendix, Fig. S4 for sampling effort). Extended seawater Mg:Ca ratios data from river mouths can be found in SI Appendix, Fig. S1. The final databases are deposited at the NOAA NCEI under accession number 0171017 at https://data.nodc.noaa.gov/cgi-bin/iso?id=gov.noaa.nodc:0171017 (DOI: 10.7289/V5571996).

