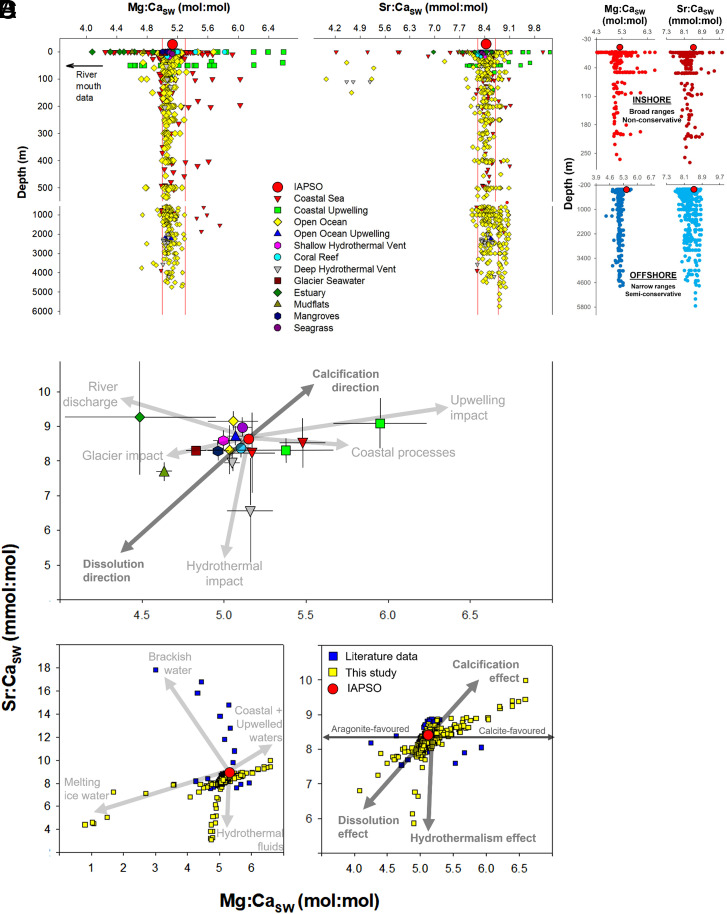
Fig. 4.
Modern ocean seawater Mg:Ca and Sr:Ca ratios vs. depth, and conceptual diagrams of Sr:Ca vs. Mg:Ca to identify processes. Data classified horizontally for seawater Mg:Ca (A) and Sr:Ca (B) ratios per ecosystem, and vertically with depth. Seawater Mg:Ca ratios data from river mouths can be found in SI Appendix, Fig. S1. Data within the red lines represent literature assumed knowledge of modern seawater ratios. (C) A selection of curated seawater Mg:Ca and Sr:Ca ratios vs. depth, classified as “coastal seas” and “open ocean” to distinguish variability at large, separating the two major environments where marine science disciples obtain samples/data. (D) Cross plots of averages and SDs of modern seawater Mg:Ca vs. Sr:Ca ratios with arrows indicating the direction of change for ocean processes. Also included are individual data points cross plots comparing literature vs. this study data. In all figure panels, IAPSO (this study) seawater Mg:Ca and Sr:Ca ratios are used for comparison.

