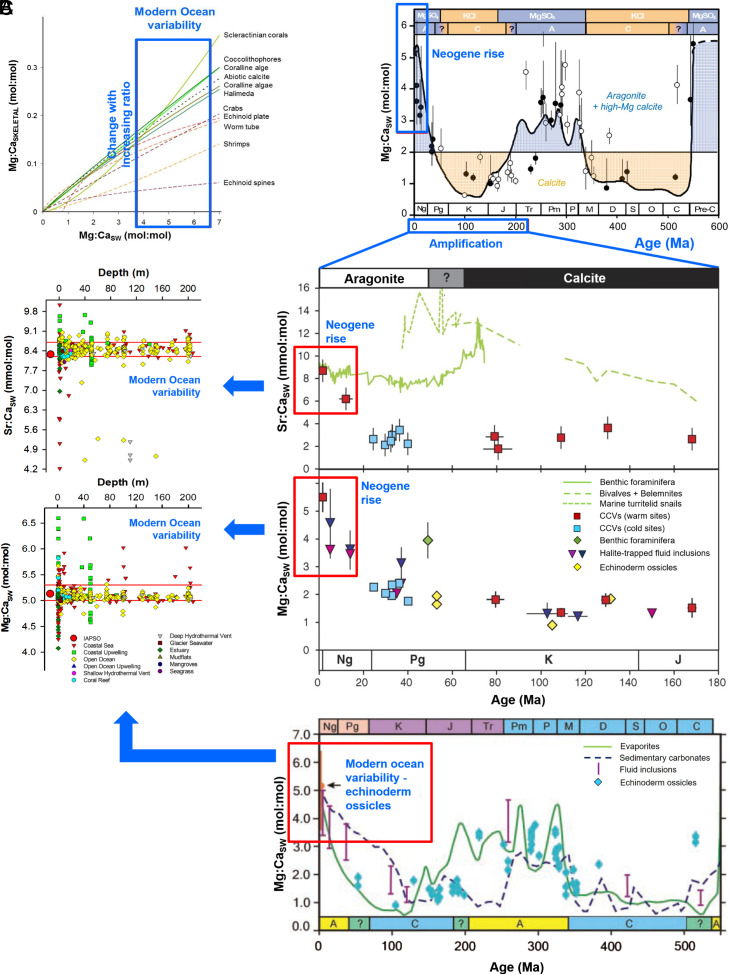
Fig. 5.
Modern ocean seawater Mg:Ca and Sr:Ca ratios compared to reconstructions over geological time intervals. (A) Relation between seawater Mg:Ca and organism skeletal Mg:Ca, indicating the effect of modern seawater Mg:Ca natural variability on marine calcification. Reprinted from ref. 3, which is licensed under CC BY 3.0. (B) Upper ocean integrated 250-m modern ocean values for seawater Mg:Ca and Sr:Ca in various ecosystems showing that variability is similar to the reconstructed Neogene Period (23.03 Ma). From refs. 7 and 23. Reprinted with permission from AAAS. (C) Phanerozoic Period (541 Ma) values for seawater Mg:Ca and the last 200 My of seawater Mg:Ca and Sr:Ca ratios are presented for comparison with modern ocean variability. Aragonite and calcite seas periods are included, and the geological periods: J, Jurassic; K, Cretaceous; Pg, Paleogene; and Ng, Neogene. Data, boxed and within the red lines, represent literature assumed knowledge of modern seawater ratios. Reprinted from ref. 3, which is licensed under CC BY 3.0. In all figure panels, “IAPSO (this study)” seawater Mg:Ca and Sr:Ca ratios are used for comparison. The raw data used in the geological time reconstructions can be checked in the figure legends in the corresponding papers (8, 12, 23).

