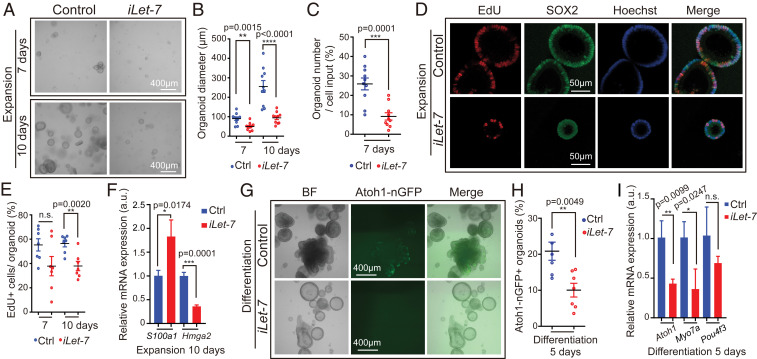
Fig. 4.
Let-7g overexpression inhibits proliferation and hair cell formation in cochlear organoid culture. Cochlear organoid cultures from stage P2 Atoh1-nGFP;iLet-7 transgenic mice and control littermates that lacked the let-7g transgene were maintained as outlined in Fig. 1A. (A–F) Dox was present throughout expansion. (G–I) Dox was added after 4 d of expansion and was present the remaining 6 d of expansion and 5 d of differentiation. (A–E) Let-7g overexpression inhibits organoid formation and organoid expansion. (A) BF images of control and let-7g overexpressing organoid cultures after 7 and 10 d of expansion. (B) Diameter of control and let-7g overexpressing organoids in A (n = 10, three independent experiments). (C) Organoid forming efficiency of control and let-7g overexpressing organoids (n = 10, three independent experiments). (D) Cell proliferation in control and let-7g overexpressing organoids. A single EdU pulse was given at 7 or 10 d (shown) of expansion and EdU incorporation (red) was analyzed 1 h later. SOX2 (green) marked prosensory cells/supporting cells, Hoechst (blue) staining marked cell nuclei. (E) Percentage of EdU+ cells in D (n = 7, two independent experiments). (F) qRT-PCR analyzing S100a1 and Hmga2 mRNA expression in control and iLet-7 transgenic organoids at 10 d of expansion (n = 3, from one representative experiment, two independent experiments). (G–I) Let-7g overexpression inhibits hair cell formation. (G) BF and green fluorescent images (Atoh1-nGFP) of control and let-7g overexpressing organoid cultures. (H) Percentage of Atoh1-nGFP+ organoids in G (n = 6 for control group, n = 7 for iLet-7 group, two independent experiments). (I) qRT-PCR analyzing hair cell-specific (Atoh1, Myo7a, Pou4f3) mRNA expression in control and let-7g overexpressing organoids after 5 d of differentiation (n = 3, from one representative experiment, two independent experiments). Bars in F and I represent mean ± SD, otherwise individual data points and their mean ± SD were plotted. Note that the individual data points in B and E represent the average values per animal. n = animals analyzed per group. Two-tailed, unpaired Student’s t test was used to calculate P values.

