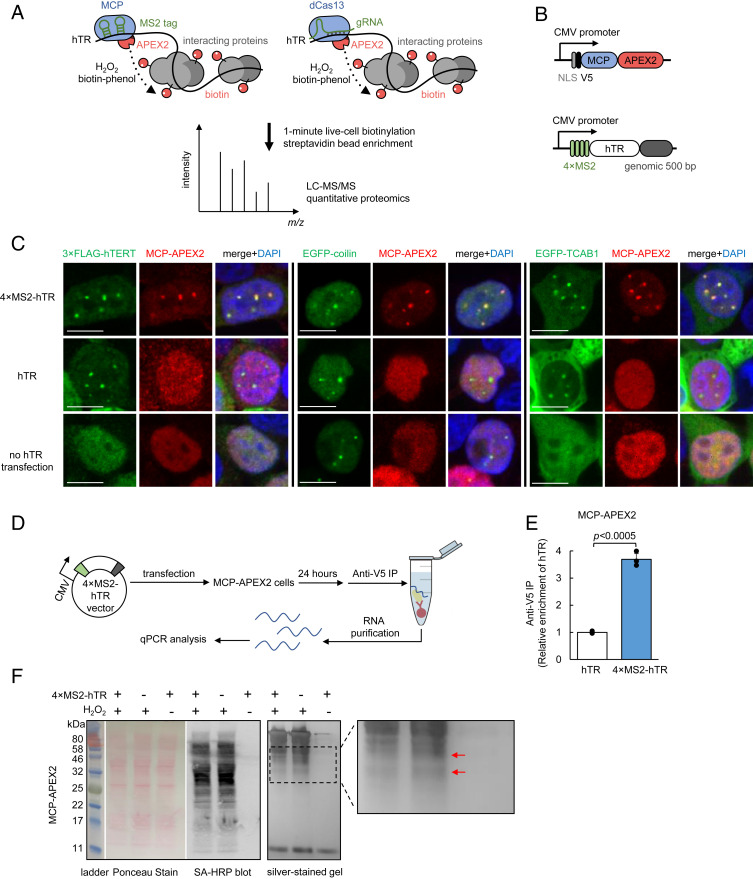
Fig. 1.
Targeting APEX2 to human telomerase RNA with MS2-MCP. (A) Scheme of APEX2-mediated proximity labeling of human telomerase RNA (hTR) interacting proteins. (Left) APEX2 is targeted to MS2 stem-loop-tagged hTR via fusion to MS2 coat protein (MCP). (Right) APEX2 is targeted to hTR via fusion to catalytically dead Cas13 protein (dCas13) and a guide RNA (gRNA). To initiate labeling, H2O2 was added for 1 min to cells preloaded with biotin-phenol, which is oxidized by APEX2 into a phenoxyl radical to covalently tag proximal endogenous proteins. Biotinylated proteins are enriched with streptavidin beads, then identified by LC-MS/MS. (B) Design of MCP-APEX2 and 4×MS2-hTR expression constructs. Genomic 500 bp is the 500-bp genomic sequence at the 3′ end of endogenous hTR. (C) Fluorescence imaging of MCP-APEX2 localization to hTR foci. HEK293T cells are transfected with either 4×MS2-hTR (Top), untagged hTR (Middle), or no hTR (Bottom). MCP-APEX2 is visualized by anti-V5 staining (Alexa Fluor 647, Middle column). hTR foci are visualized with either cotransfected 3×FLAG-hTERT (anti-FLAG staining, Alexa Fluor 488, Left image set), cotransfected EGFP-coilin (Middle image set), or cotransfected EGFP-TCAB1 (Right image set). Nuclei are stained with DAPI (Scale bars, 10 µm.) (D) Scheme of RNA immunoprecipitation for validation of MCP-APEX2 targeting to hTR. HEK293T cells stably expressing MCP-APEX2 are transfected with 4×MS2-hTR or untagged hTR. RNA bound to APEX2 is immunoprecipitated with anti-V5 antibody followed by RT-qPCR quantitation. (E) RT-qPCR of RNA immunoprecipitation following experiment in D. The fold enrichment of hTR in cells transfected with 4×MS2-hTR is normalized against the untagged hTR control. Data are analyzed using a one-tailed Student’s t test (n = 3). (F) Biochemical analysis of biotinylated proteins from HEK293T cells stably expressing MCP-APEX2. Lysates were run on SDS/PAGE and analyzed by Ponceau stain (Left) or streptavidin blotting (Middle). Total eluted protein after streptavidin bead enrichment is visualized by silver staining (Right). A magnified view of the boxed region is shown on the right. Red arrows point to proteins differentially biotinylated by targeted vs. nontargeted APEX2.

