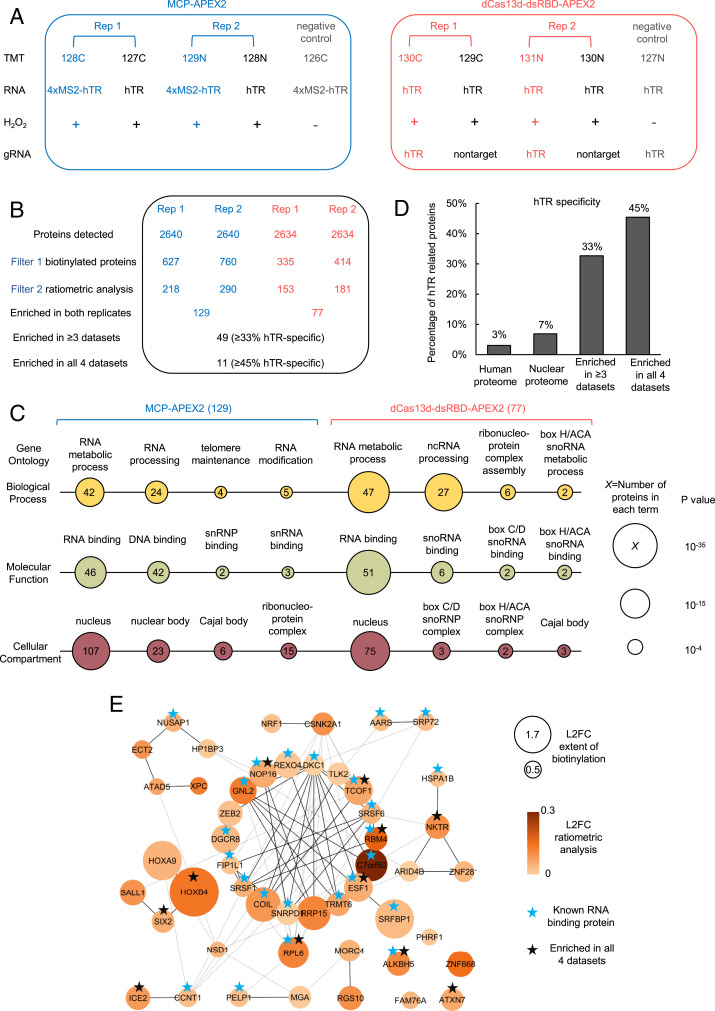
Fig. 3.
Proteomic analysis of hTR interactome via proximity labeling. (A) Design of the proteomic experiment. HEK293T cells stably expressing the indicated APEX2 constructs are transfected with corresponding hTR and gRNA and then labeled with biotin-phenol as in Fig. 1A. Tandem mass tags (TMTs) are used for quantitative proteomic analysis. Each experimental set contains two replicates and negative controls with nontargeted APEX2 or H2O2 omitted. The different TMT channels are represented as 128C, 127C, 129N, 128N, 126C, 130C, 129C, 131N, 130N, and 127N. (B) Filtering of the proteomic data to identify enriched hTR interacting proteins. The table shows the number of proteins remaining after each filtering step. hTR specificity is calculated from interaction partners of known hTR binding proteins (SI Appendix, Table S1) in the BioGRID database (see Methods). Scatterplots in SI Appendix, Fig. S13 show a correlation between TMT ratios across replicates. (C) Gene ontology analysis of proteins enriched by MCP-APEX2 (Left) and dCas13d-dsRBD-APEX2 (Right ). Only a subset of significantly enriched GO terms related to hTR is shown. Node size scales with −log10 (P value). The number of proteins associated with each term is indicated inside each node. (D) hTR specificity analysis, calculated as in B, for the total human proteome (20,996 proteins), nuclear proteome (7,530 proteins), proteins enriched in three or more of our proteomic datasets (49 proteins), and proteins enriched in all four datasets (11 proteins). (E) Protein–protein interaction (PPI) map of proteins enriched in three or more of our proteomic datasets. Known RNA binding proteins are marked with blue stars. Proteins enriched in all four proteomic datasets are marked with black stars. Node size scales with protein biotinylation extent and node color scales with the ratio of enrichment in targeting vs. nontargeting control. Markov clustering was performed with PPI scores from the STRING database (see Methods). L2FC, log2 fold change.

