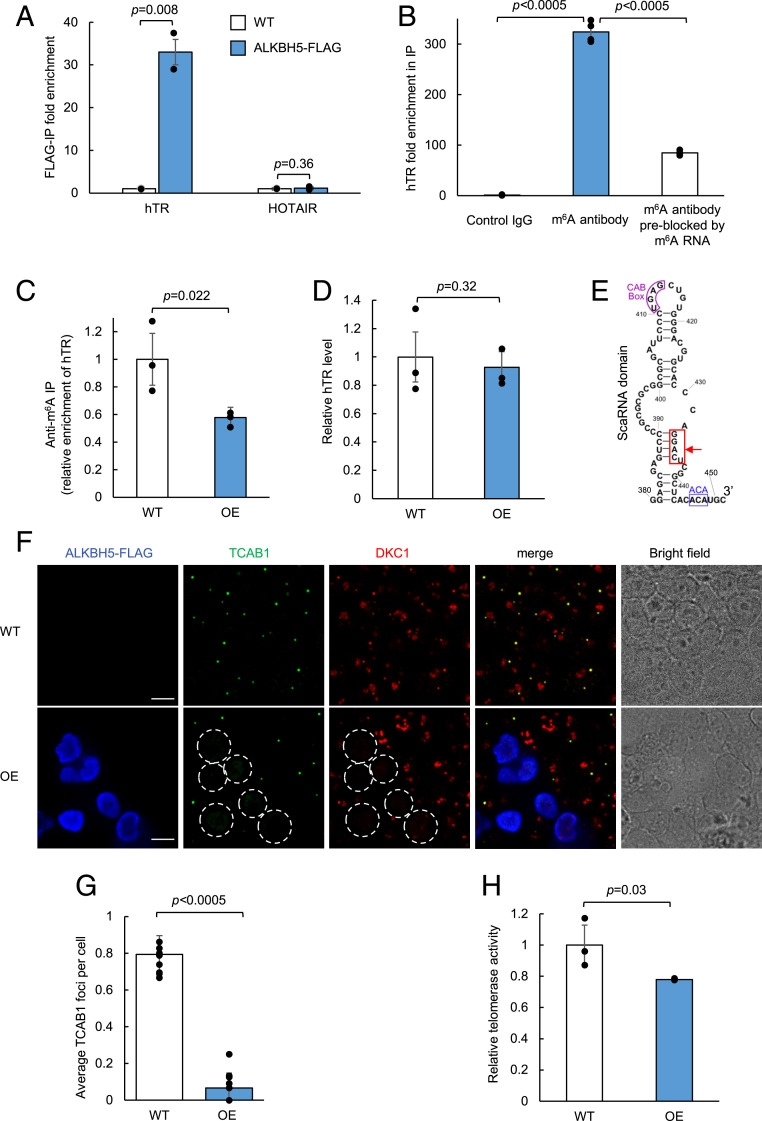
Fig. 4.
Regulation of hTR function by m6A demethylase ALKBH5. (A) RT-qPCR of RNA immunoprecipitation for validation of ALKBH5 binding to hTR. Wild-type (WT) HEK293T cells are either mock transfected or transfected with ALKBH5-FLAG. RNA bound to ALKBH5 is immunoprecipitated with anti-FLAG antibody followed by RT-qPCR quantitation. Fold enrichment of the respective RNA in ALKBH5-FLAG-expressing cells is normalized against WT cells. Data are analyzed using a one-tailed Student’s t test (n = 2). (B) RNA immunoprecipitation followed by RT-qPCR of hTR. Total RNA extract from wild-type HEK293T cells is immunoprecipitated with either a control rabbit monoclonal IgG antibody, an anti-m6A rabbit monoclonal IgG antibody, or the m6A antibody preblocked with a synthetic m6A modified luciferase RNA. The immunoprecipitated RNA is quantified by RT-qPCR. Fold enrichment of hTR is normalized against the control IgG pulldown. Data are analyzed using a one-tailed Student’s t test (n = 4). (C) Anti-m6A immunoprecipitation of hTR. Total RNA extract from either WT or ALKBH5-overexpressing (OE) HEK293T cells is immunoprecipitated with an anti-m6A antibody and quantified by RT-qPCR. Fold enrichment of hTR in OE cells is normalized against the WT cells. Data were analyzed using a one-tailed Student’s t test (n = 3). (D) RT-qPCR of hTR expression level in WT and ALKBH5-OE cells. Total RNA extract from either WT or ALKBH5-OE HEK293T cells was quantified by RT-qPCR. hTR level in OE cells was normalized against WT cells. Data were analyzed using a one-tailed Student’s t test (n = 3). (E) Sequence and structure of nucleotides 380 to 451 in hTR. The m6A consensus motif GGACU is boxed in red with an arrow pointing to the putative methylated adenosine. The ACA box and CAB box motifs in the small Cajal body-specific RNA (scaRNA) domain are highlighted in blue and purple, respectively. (F) Fluorescence imaging of telomerase component TCAB1 and DKC1 in WT and ALKBH5-OE cells. WT or ALKBH5-OE HEK293T cells are fixed and immunostained with antibodies against endogenous TCAB1 (Alexa Fluor 488), DKC1 (Alexa Fluor 405), and ALKBH5-FLAG (anti-FLAG phycoerythrin conjugate). ALKBH5-OE cells are circled with white dotted lines (Scale bars, 10 µm.) (G) Quantitation of imaging data in E. The total number of TCAB1 foci is divided by the total number of WT cells or by the total number of ALKBH5-OE (FLAG-positive) cells in each field of view. Data were analyzed using a one-tailed Student’s t test (n = 10). (H) Telomerase activity assay in WT and ALKBH5-OE cells. The 1 × 10⁶ WT or ALKBH5-OE HEK293T cells were analyzed using a commercialized PCR-based telomerase activity assay (TRAP). Telomerase activity in OE cells is normalized against the WT cells. Gel showing the resulting PCR products is shown in SI Appendix, Fig. S17. Data were analyzed using a one-tailed Student’s t test (n = 3).

