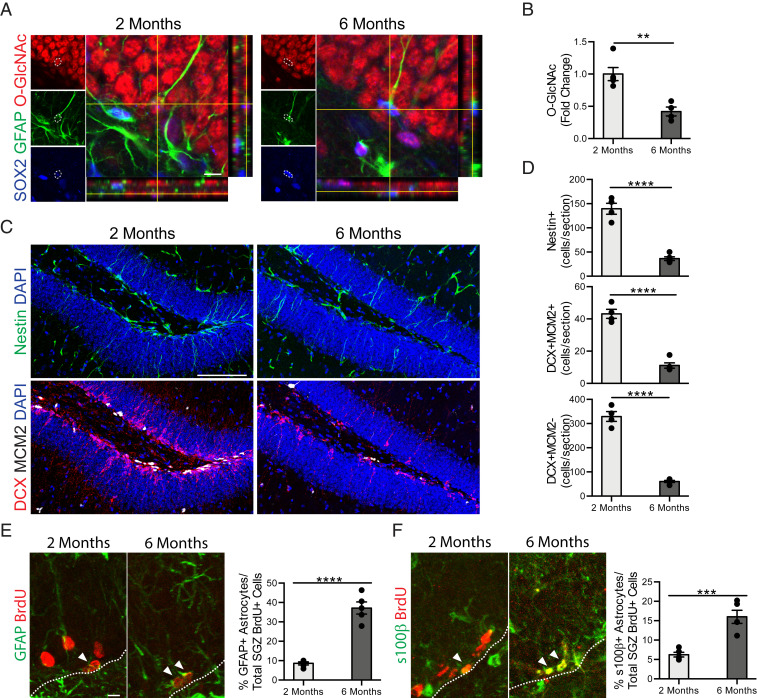
Fig. 1.
Age-related decreased NSC O-GlcNAc levels is coincident with a decline in neurogenesis and an increase in gliogenesis in the mature hippocampus. (A) Representative single z-planes and orthogonal projections of a confocal image z-stack of 2- or 6-mo-old mouse hippocampus, labeled with anti-Sox2, anti-GFAP, anti–O-GlcNAc, and DAPI. (Scale bar, 10 µm.) (B) Quantification of the fold-change of the average O-GlcNAc intensity normalized to area measured in each GFAP+/Sox2+ NSC across all z-stacks per animal (n = 4 animals per group). (C) Representative maximum intensity projections of a confocal image z-stack of 2- or 6-mo-old mouse hippocampus, labeled with DAPI and anti-Nestin (Upper) or DAPI, anti-Dcx, and anti-Mcm2 (Lower). (Scale bar, 100 µm.) (D) Quantification of Nestin+ radial NSCs (Top), Dcx+/MCM2+ proliferating neuroblasts (Middle), and Dcx+/MCM2− immature neurons (Bottom) in 2- or 6-mo-old mice (n = 4 to 5 animals per group). (E) Representative maximum intensity projections of a confocal image z-stack of 2- or 6-mo-old mouse hippocampus, labeled with anti-GFAP and anti-BrdU. Mice were given six daily intraperitoneal injections of BrdU (50 mg/kg) 30 d before killing. Quantification of the percentage of GFAP+/BrdU+ astrocytes out of total BrdU+ cells in the subgranulzar zone (SGZ) of the DG (n = 4 to 5 animals per group; arrowheads, astrocytes; white dashed line, SGZ). (Scale bar, 10 µm; also applies to F.) (F) Representative maximum-intensity projections of a confocal image z-stack of 2- or 6-mo-old mouse hippocampus, labeled with anti-s100β and anti-BrdU (Left). Mice were treated as in E. Quantification of the percentage of s100β+/BrdU+ astrocytes out of total BrdU+ cells in the SGZ of the DG (n = 4 to 5 animals per group; arrowheads, astrocytes; white dashed line SGZ). Data are represented as mean ± SEM; **P < 0.01, ***P < 0.001, ****P < 0.0001; t test.

