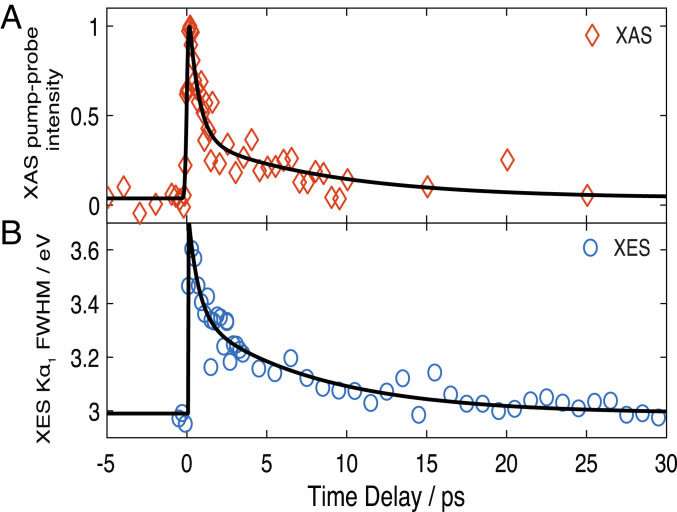
Fig. 5.
Temporal evolution of the transient XANES and XES signals. (A) Intensity of the XANES signal at 7,125.3 eV. (B) FWHM extracted from an asymmetric Voigt fit of the Kα1 line at 6,405 keV (SI Appendix, section 6 and Fig. S6). The black trace represents the fit using a function with an IRF-limited rise (∼140 fs for the XAS and ∼150 fs for the XES) and a biexponential decay. The fit parameters (time constants and preexponential factors) are given in SI Appendix, Table S1.

