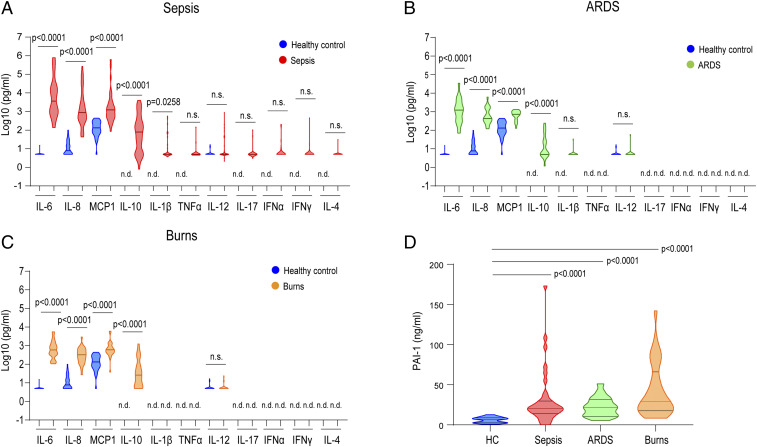
Fig. 1.
Cytokine and chemokine profiles of CRS patients. (A‒D) Cytokine, chemokine (A‒C), and PAI-1 (D) levels were measured in the sera of patients with CRS (sepsis, n = 37; ARDS, n = 19; burns, n = 35). Comparisons were made by using a Mann‒Whitney U test (A‒C) or Kruskal‒Wallis test for multiple-comparisons (D). Statistically significant differences are indicated; n.s.: nonsignificant; n.d.: nondetectable. Bar indicates the median. Blue graph indicates healthy control (HC, n = 36). Other colors are indicated in the graph.

