Fig. 4.
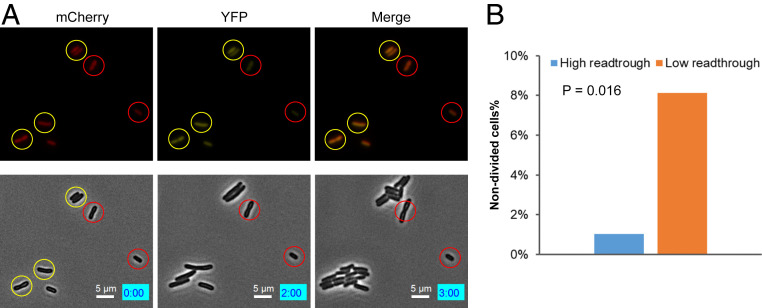
Single cells with high UGA readthrough tolerate acid stress better. MG1655 cells carrying the mCherry-TGA-YFP reporter were grown in LB with 1% glucose for 24 h before treatment with LB at pH 3 for 30 min. Cells were then placed on an LB agar pad for time-lapse microscopy. Fluorescence imaging was taken at time 0. (A) Microscopy images showing individual cells with fluorescence (Top) and phase contrast (Bottom). Cells with high and low UGA readthrough are indicated by yellow and red circles. The numbers in the blue boxes indicate the time in hours and minutes. Note that the cells with low readthrough in these images did not divide or divided after 3 h. (B) Percentage of nondivided cells at 3 h in high and low readthrough groups. The P value was determined using the χ2 test (n = 221).

