Fig. 4.
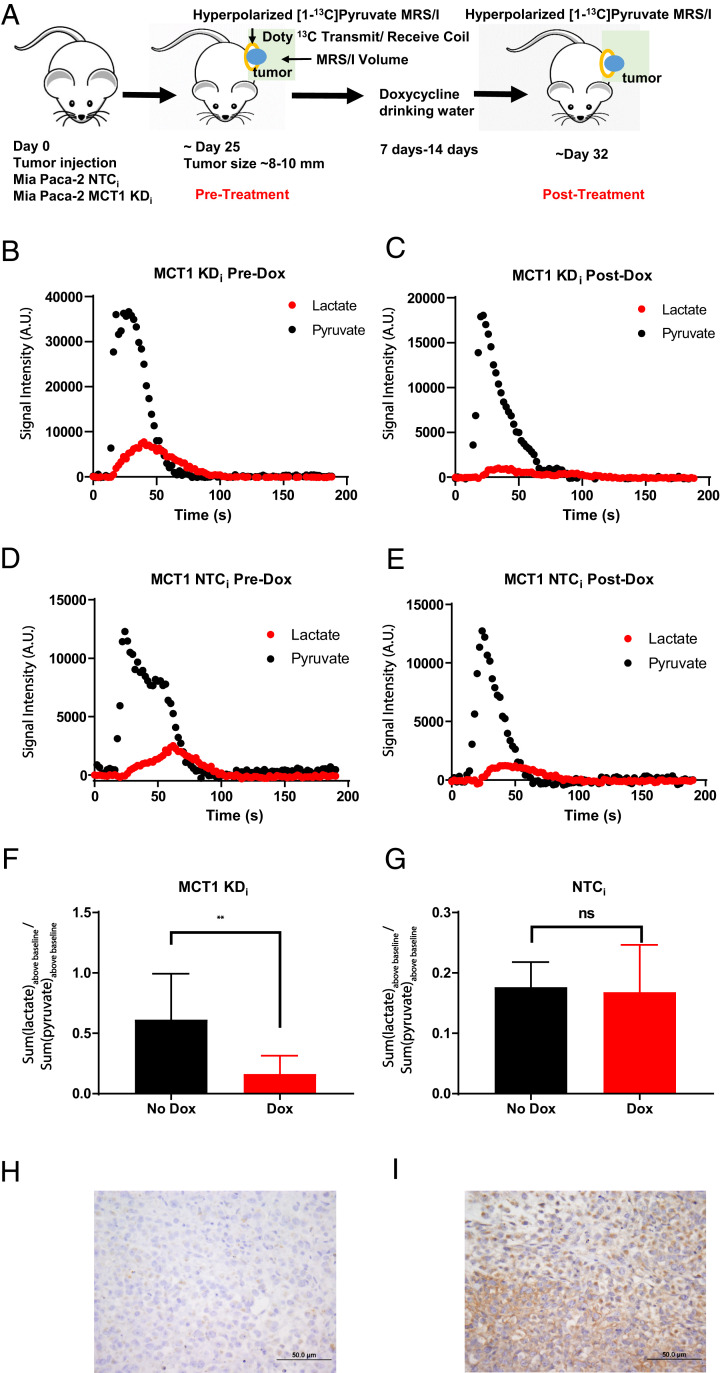
Hyperpolarized [1-13C]pyruvate-to-[1-13C]lactate conversion in response to MCT1 expression in vivo. (A) Timeline of the animal study schedule. Each animal served as its own control pre- and postdoxycycline. (B and C) Hyperpolarized [1-13C]pyruvate and [1-13C]lactate spectra over time in a mouse bearing a Mia Paca-2 KDi tumor predoxycycline (B) and postdoxycycline (C) treatment. Hyperpolarized [1-13C]pyruvate and [1-13C]lactate spectra over time in a mouse bearing a Mia Paca-2 MCT1 NTCi tumor predoxycycline (D) and postdoxycycline (E) treatment. (F) The sum of hyperpolarized [1-13C]lactate normalized to the sum of hyperpolarized [1-13C]pyruvate of all mice bearing Mia Paca-2 MCT1 KDi tumors pre- and postdoxycycline treatment (n = 4 animals per group). (G) The sum of hyperpolarized [1-13C]lactate normalized to the sum of hyperpolarized [1-13C]pyruvate of all mice with Mia Paca-2 MCT1 NTCi tumors pre- and postdoxycycline treatment (n = 4 animals per group). Representative IHC staining for MCT1 from Mia Paca-2 xenograft tumors. All tumor sections were also stained with hematoxylin and eosin. (H) Mia Paca-2 MCT1 KDi tumors postdoxycycline treatment. (I) Mia Paca-2 MCT1 NTCi tumors post doxycycline treatment. Error bars represent SD. **P < 0.01 (paired t test). A.U., arbitrary units; ns, not significant.

