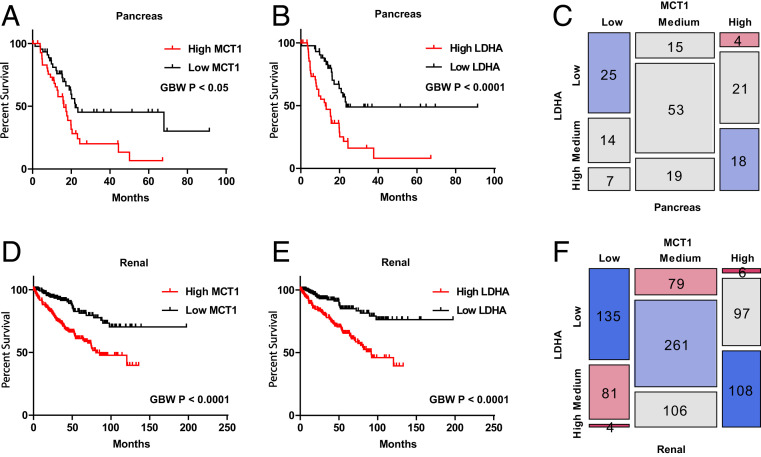
Fig. 5.
mRNA expression profiles of MCT1 or LDHA correlated with overall patient survival in pancreatic and renal cancers. Gehan–Breslow–Wilcoxon tests were used to estimate the P values between high- and low-expression groups (using the top and bottom 25% as the cutoff for grouping). Pearson χ2 tests were used to estimate the P values between MCT1 and LDHA expression. (A and B) Kaplan–Meier survival analysis in pancreatic cancer patients (n = 176) indicates that high MCT1 or LDHA expression correlates with poorer patient survival. (A) MCT1 (P < 0.05). (B) LDHA (P < 0.0001). (C) Mosaic plot in pancreatic cancer patients indicates that MCT1 expression correlates with LDHA expression (P < 0.0001). (D and E) Kaplan–Meier survival analysis in renal cancer patients (n = 877) indicates that high MCT1 or LDHA expression correlates with poorer patient survival. (D) MCT1 (P < 0.0001). (E) LDHA (P < 0.0001). (F) Mosaic plot in renal cancer patients indicates that MCT1 expression correlates with LDHA expression (P < 0.0001).

