Fig. 1.
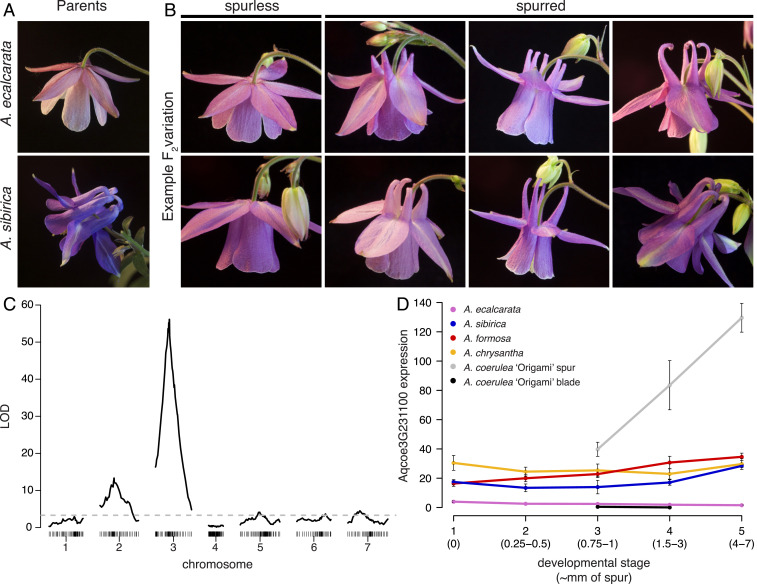
Identifying a candidate locus for spur loss in A. ecalcarata. (A) Flowers from the cross parents, spurless A. ecalcarata (Top) and A. sibirica with curved spurs (Bottom). (B) Examples of variation in petal morphology segregating in the F2 generation of the cross between A. ecalcarata and A. sibirica, including plants that do not produce spurs at all (column 1) and plants exhibiting various spur morphologies (columns 2 to 4). (C) Genome-wide association of genotype with the presence/absence of spurs in the F2 generation. Logarithm of the odds (LOD) scores (y axis) for the presence or absence of spurs indicate a major QTL on chromosome 3 (x axis, genomic marker bin position by chromosome in centimorgans). The dashed line represents the 5% LOD false discovery rate. The association on chromosome 2 appears to be a result of a genomic incompatibility (SI Appendix, Table S1). (D) The expression of Aqcoe3G231100, plotted as mean normalized reads of multiple biological replicates (±SE), across several stages spanning phase I of petal development in various petal samples, including some containing spur tissue (spur +) and some lacking spur tissue (spur -). Aqcoe3G231100 is expressed at higher levels in spur + samples. Data for A. ecalcarata (spur–), A. sibirica (spur+), A. formosa (spur+), and A. chrysantha (spur+) are from ref. 21 where RNA was isolated from entire petals (n = 3 for each data point). Data for A. coerulea ‘Origami’ are from ref. 17 where RNA was isolated from petals dissected into blades (spur–) and spur cups (spur+; n = 4 for each data point). Developmental stage is represented numerically 1 to 5 as in ref. 21, and approximate spur lengths in millimeters corresponding to these stages are provided.

