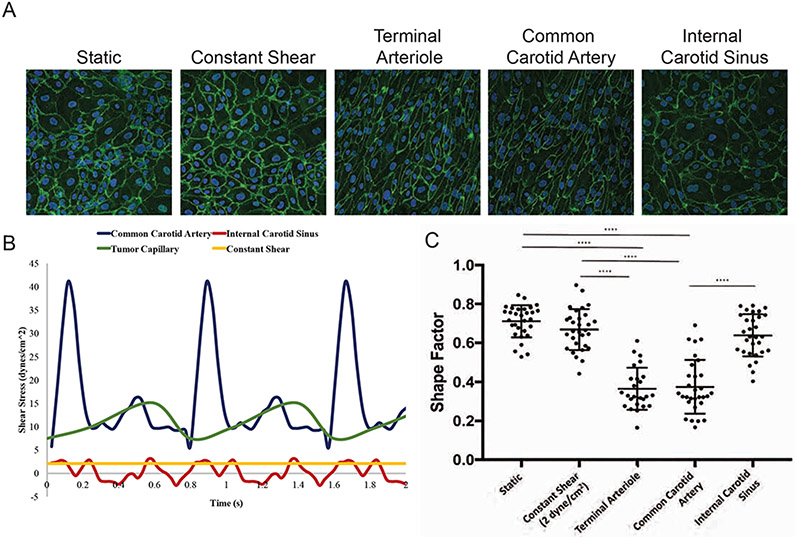
Figure 2. Shear stress regulates endothelial cell morphology.
(A) Representative images for each condition. (B) Two seconds of each waveform, or shear pattern, used in the experiments. (C) A histogram of the Shape Factor of each cell measured separated by condition. Significance is indicated by the bars (**** p < 0.0001).

