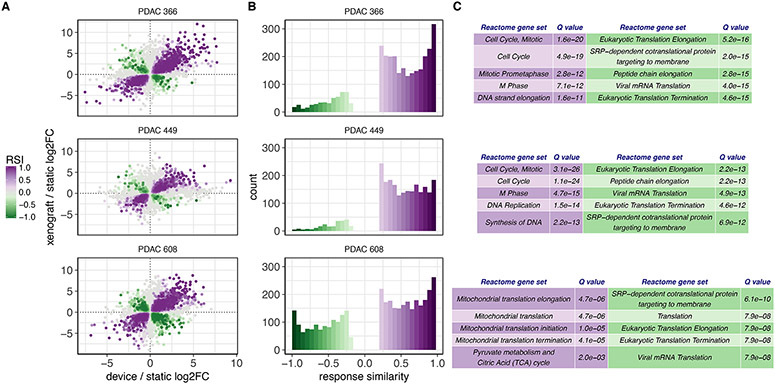
Figure 3. The PDAC TMES transcriptome resembles the xenograft transcriptome.
(A) Xenograft vs TMES scatterplots of significant (p<0.01) log2 fold changes relative to static cell culture. Points are colored by their response similarity (RSI), where darker, more saturated colors indicate transcripts that show greater evidence for joint differential expression on both axes. Purple indicates transcripts that are concordantly regulated between the two conditions, whereas green indicates discordance. (B) Histograms of RSI values (>0.2 and <-0.2) in (A). n=6 for TMES and 2D static samples and n=3 for xenografts. The asymmetry between concordant and discordant RSI values indicates that expression changes in xenografts and the TMES tend to be concordant. This demonstrates that the TMES recapitulates much of the transcriptional profile of a xenograft model. (C) Functional profiling of the concordantly (purple) and discordantly (green) regulated transcripts.

