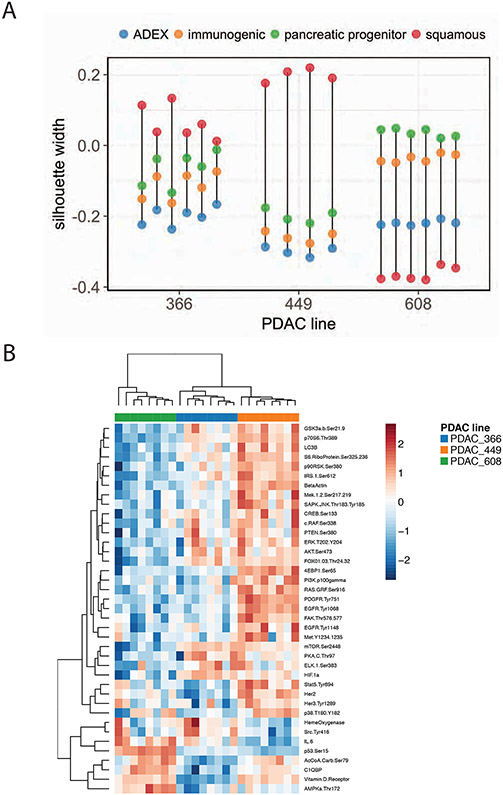
Figure 4. The PDAC TMES reveals molecular subtypes.
(A) The silhouette width of each PDAC PDX line in the TMES system when clustered with data from Bailey et al. Each vertical line represents a sample (some lines contain technical replicates), and each point within a line represents a categorization of that sample with respect to the Bailey et al. data. Positive silhouette widths (values greater than 0) indicate that a sample is well categorized, whereas negative widths indicate poor categorization. (B) cluster analysis of RPPA data from PDAC PDX tumor cells grown in the TMES. 366 and 449 cluster together.

