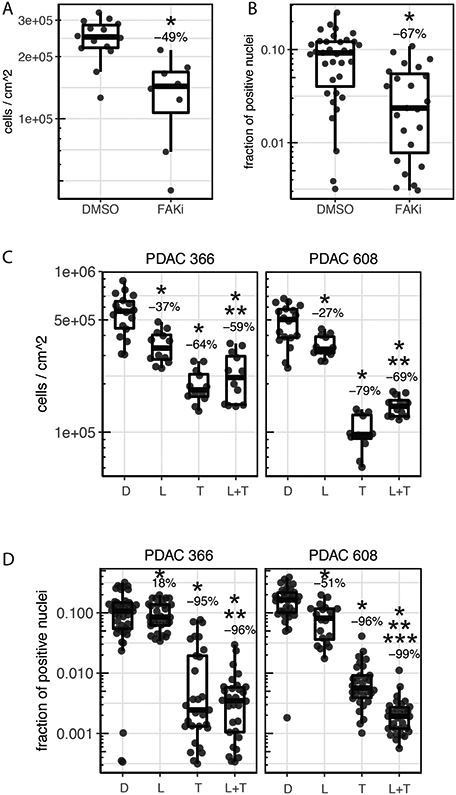
Figure 5. The PDAC TMES reproduces in vivo drug responsiveness.

(A, B) Cells were grown in the TMES for four days and then dosed for 3 days with DMSO (0.058%) or 5.8uM PF-562,271 (FAKi) and (A) cell number was determined using picogreen signal as a surrogate with a standard curve (*p=0.0004) or (B) Edu positive tumor cells were scored to determine proliferating fraction (*p=0.00005). Picogreen measures total cells (tumor and stellate) and Edu was co-imaged with anti-cytokeratin 18 to measure Edu incorporation only in tumor cells. (C, D) Cells were grown in the TMES for four days and then dosed for 3 days with DMSO (0.058%) or 4.2uM lapatinib (L), 36nM trametinib (T), or the combination of the two (L+T) and (C) cell number was determined using luciferase signal as a surrogate with a standard curve (*p<0.007 compared to DMSO; **p≤0.001 compared to either lapatinib or trametinib alone) or (D) Edu positive tumor cells were scored to determine proliferating fraction (*p<0.0002 compared to DMSO; **p<0.004 compared to lapatinib alone; ***p=0.001 compared to trametinib alone). N=3, with 5 independent measurements across the transwell from each replicate.
