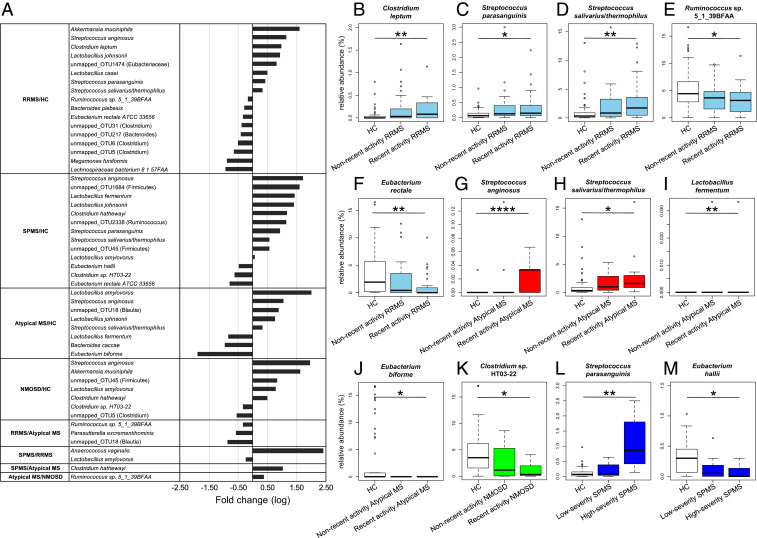
Fig. 2.
Significantly increased or decreased microbial species/OTUs between the five subject groups and their correlation with clinical severity. (A) The list of 30 species/OTUs exhibiting significant changes in abundance between any two subject groups with fold-change (log10) between the related two groups. (B–F) Relative abundance of C. leptum (mapped_CL432; B), S. parasanguinis (mapped_CL5; C), S. salivarius/thermophilus (mapped_CL267; D), Ruminococcus sp. 5_1_39BFAA (mapped_CL372; E), E. rectale (mapped_CL145; F) in the HC, nonrecent activity RRMS, and recent activity RRMS groups. (G–J) Relative abundance of S. anginosus (mapped_CL121; G), S. salivarius/thermophilus (mapped_CL267; H), L. fermentum (mapped_CL129; I), E. biforme (mapped_CL429; J) in the HC, nonrecent activity atypical MS, and recent activity atypical MS groups. (K) Relative abundance of Clostridium sp. HT03-22 (mapped_CL169; K) in the HC, nonrecent activity NMOSD, and recent activity NMOSD groups. (L and M) Relative abundance of S. parasanguinis (mapped_CL5; L), E. hallii (mapped_CL78; M) in the HC, low-severity SPMS, and high-severity SPMS groups. Each box plot represents median, interquartile range, minimum, and maximum values. *P < 0.05, **P < 0.01, ****P < 0.0001 based on the Wilcoxon rank sum test with the Benjamini–Hochberg method for multiple group comparisons.

