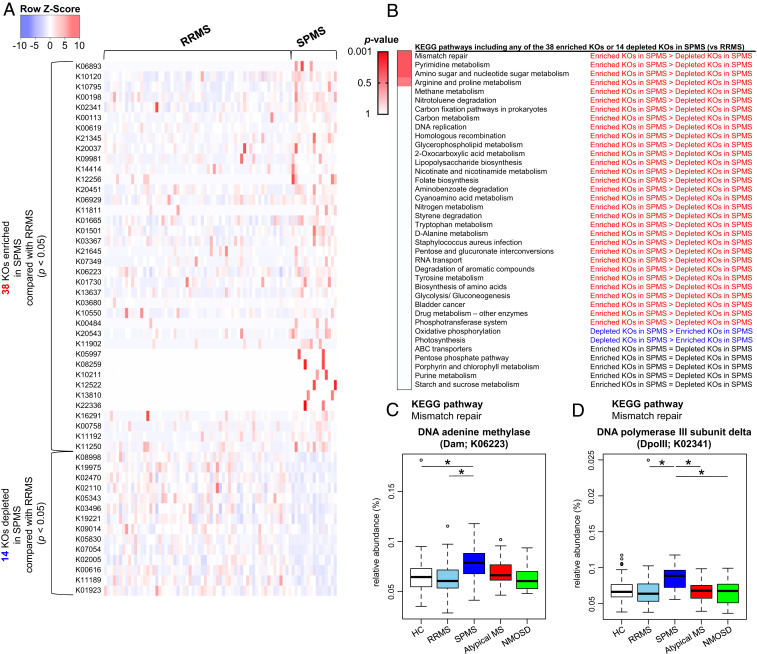
Fig. 4.
Differences in functional profile of gut microbiome between RRMS and SPMS. (A) The list of 38 significantly enriched and 14 significantly depleted KEGG orthologies (KOs) in the SPMS group compared to those in the RRMS group (Wilcoxon test, P < 0.05). The Z-score based on the abundance of each KO is depicted from lowest (blue) to highest (red) according to the scale shown at the Top. (B) List of KEGG pathways including at least 1 of the 38 significantly enriched KOs (SPMS-enriched KOs) or 1 of the 14 significantly depleted KOs (SPMS-depleted KOs) in the comparisons between the RRMS and SPMS groups. These individual pathways are ranked based on the ratios of SPMS-enriched KOs to SPMS-depleted KOs. P value is based on the Fisher’s exact test. (C and D) Relative abundance of the two significantly enriched KOs in SPMS compared with RRMS which are included in the mismatch repair pathway. The relative abundance of DNA adenine methylase (Dam; C) and DNA polymerase III subunit delta (DpoIII; D) between the five subject groups. Each box plot represents median, interquartile range, minimum, and maximum values. *P < 0.05 based on Wilcoxon rank sum test with the Benjamini–Hochberg method for multiple group comparisons.

