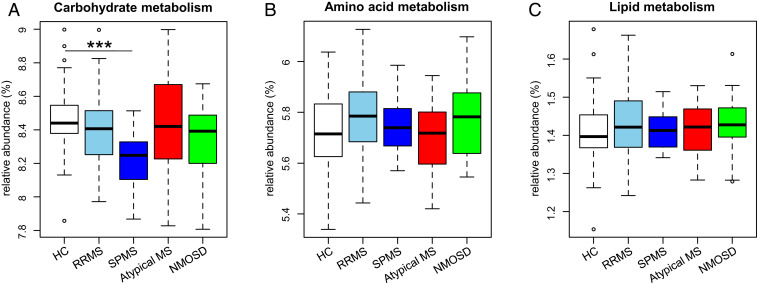
Fig. 5.
Metagenomic functional profile of three major nutrient metabolisms in the five subject groups. (A–C) Relative abundance of carbohydrate metabolism (A), amino acid metabolism (B), and lipid metabolism (C) at the KEGG subcategory level in the five groups. Each box plot represents median, interquartile range, minimum, and maximum values. *P < 0.05, **P < 0.01, ***P < 0.001 based on Wilcoxon rank sum test with the Benjamini–Hochberg method for multiple group comparisons.

