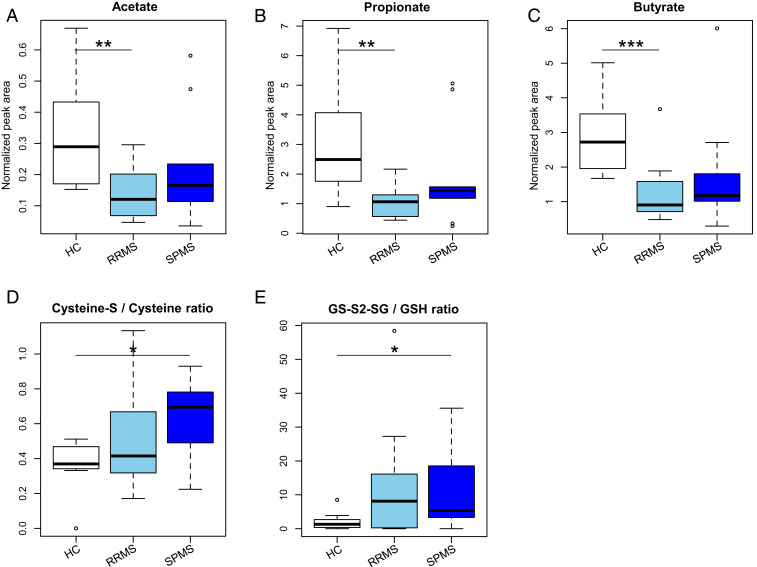
Fig. 6.
Levels of short chain fatty acids and an index of oxidative stress in the feces of the patients with RRMS and SPMS. (A–C) The concentration of acetate (A), propionate (B), and butyrate (C) in the feces of the patients with RRMS, SPMS, and HC. (D and E) The ratio of cysteine persulfide to cysteine (D) and glutathione persulfide to glutathione (E) in the feces of the patients with RRMS, SPMS, and HC. Each box plot represents median, interquartile range, minimum, and maximum values. *P < 0.05, **P < 0.01, ***P < 0.001, based on Wilcoxon rank sum test.

