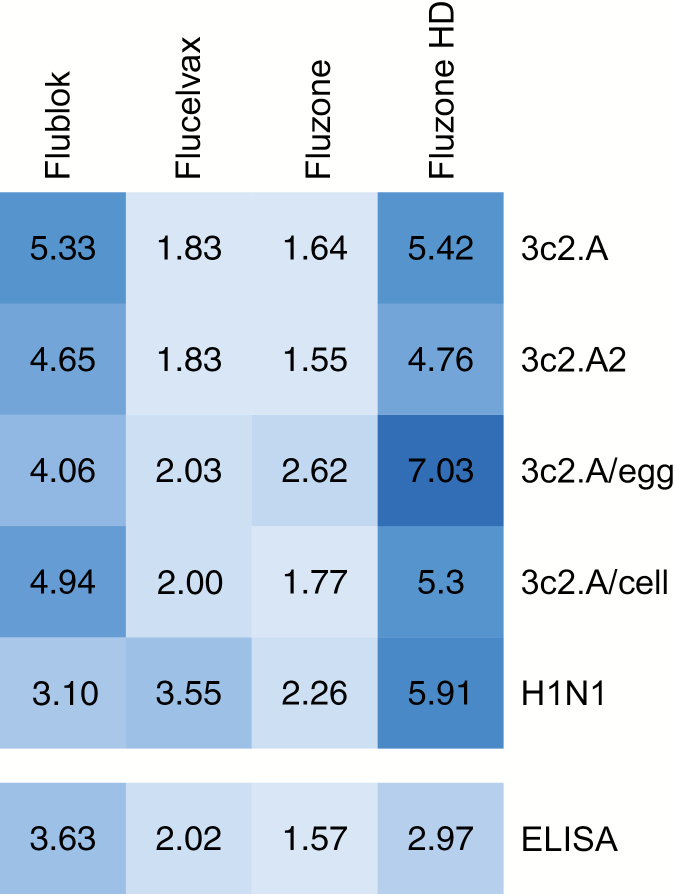
Figure 2.
Heat map of fold change in geometric mean neutralizing antibody levels (foci reduction neutralization test90) and ELISA titers (immunoglobulin G concentration) upon influenza vaccination during the 2017–2018 season. Postvaccination titers were divided by prevaccination titers to calculate fold change. Darker colors indicate higher fold changes. Abbreviations: ELISA, enzyme-linked immunosorbent assay; HD, high-dose.

