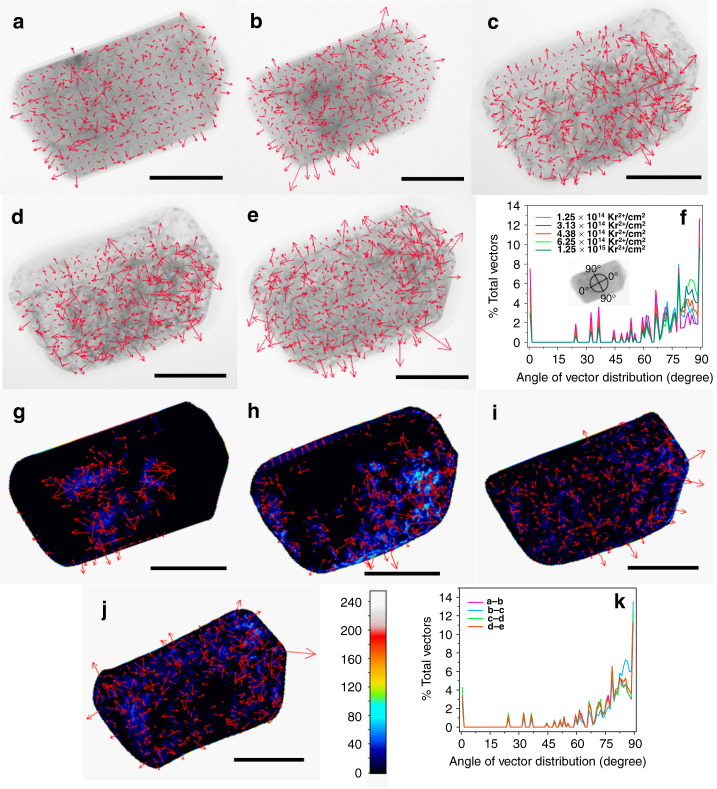
Fig. 5. Defect clusters evolution in LiNiO2 under Kr ion irradiation.
Gradient vector calculated and superimposed on the bright-field two-beam image of a LiNiO2 particle irradiated at the fluence of a 1.25 × 10¹⁴ Kr2+/cm2, b 3.13 × 10¹⁴ Kr2+/cm2, c 4.38 × 10¹⁴ Kr2+/cm2, d 6.25 × 10¹⁴ Kr2+/cm2, and e 1.25 × 10¹⁵ Kr2+/cm2 at room temperature. The bright-field images are taken from the [100] zone axis. All the scale bars in the image a–e correspond to a length of 100 nm. f Distribution of the gradient vectors of images a–e against the angle of the gradient vector. The inset shows the scheme of how the angle of the gradient vector was defined. Dynamic defect evolution in a LiNiO2 particle with increasing fluence of Kr ion irradiation (g–j). The dynamic defect evolution is studied through the subtraction of the image acquired at higher irradiation dose from that of the lower irradiation dose (e.g., image b subtracted from image a). Defect evolution (g) from image a to image b, h from image b to image c, i from image c to image d, and j from image d to image e. All the scale bars from image g to image j correspond to a length of 100 nm. The color bar shows the corresponding values of the subtracted pixels after the subtracted grayscale image was converted to an RGB image. k Distribution of the gradient vector of images g–j against the angle of the gradient vector.

