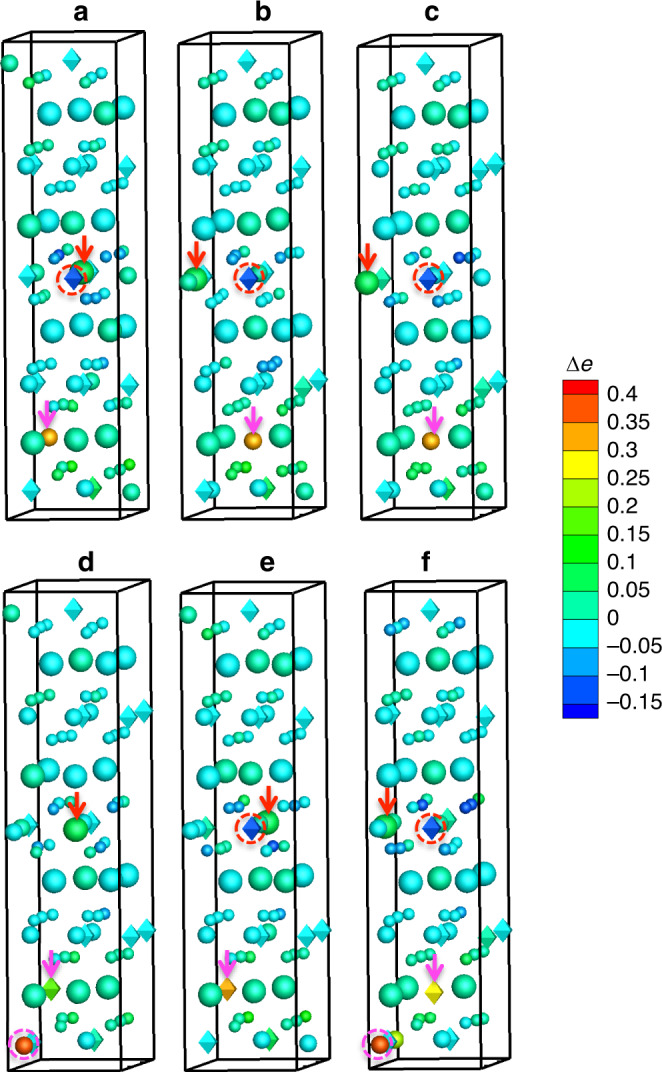
Fig. 7. Charge transfer distribution due to antisite defects in P2-Na2/3Fe1/2Mn1/2O2.

Each atom is colored by the change of its valence electrons with respect to its counterpart in the pristine system. Red and magenta arrows indicate the NaTM and TMNa antisite defects, respectively. Red dashed circles indicate a significant loss of electrons of some nearby Mn cations. Magenta dashed circles indicate a large gain of electrons of some nearby Fe cations. Large spheres: Na; medium spheres: Fe; medium diamonds: Mn; small spheres: O. The antisite defect pairs are: a Fe1–Na1, b Fe2–Na2, c Fe3–Na2, d Mn1–Na1, e Mn2–Na1, and f Mn3–Na2.
