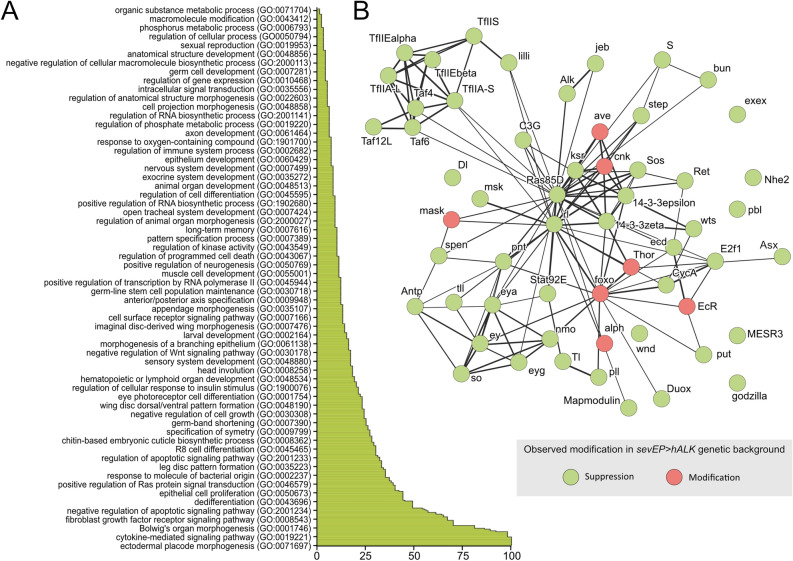
Figure 3.
Candidate genes revealed by the modifier screen. (A) Graphic representation of a PANTHER4.0-driven gene ontology (GO) enrichment analysis of Alk modifying loci. (B) String analysis of the Alk modifier network. For visualization purposes, the line thickness represents the strength of support for an interaction within the network. Suppressors are shown in green; other modifiers are depicted in red. Details of the individual alleles tested are found in Table S1B.

