Figure 8.
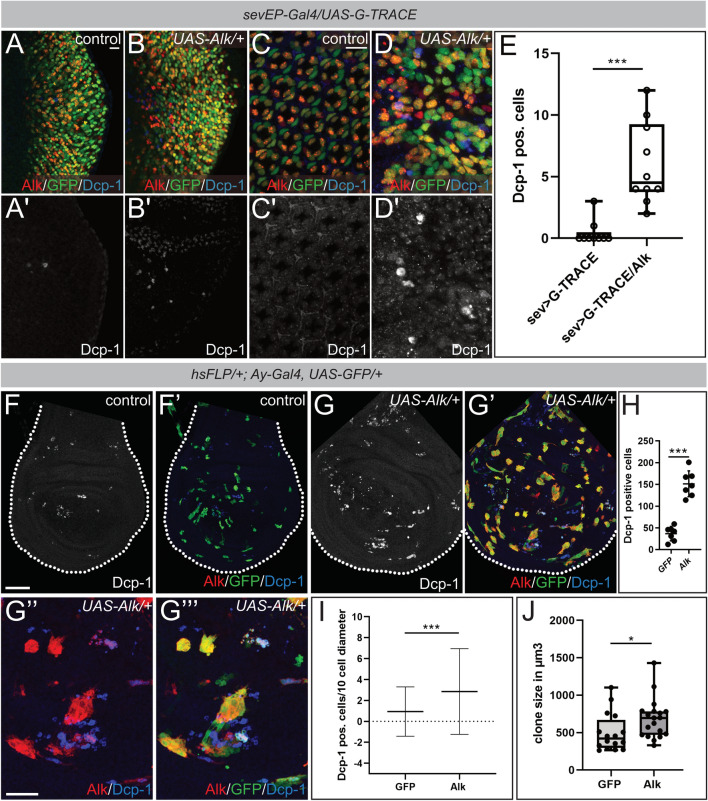
Alk-expressing cells exhibit features of super-competitors. (A–D’) Anti cleaved Drosophila Death caspase-1 (Dcp-1) staining of sevEP-Gal4 > UAS-G-TRACE (A,A’,C,C’) and sevEP-Gal4 > UAS-G-TRACE/UAS-Alk (B,B’,D,D’) eye discs at the wandering 3rd instar larval stage and 50 h apf. Scale bars = 10 µm. (E) Quantification of Dcp-1 positive cells using a bee-swarm boxplot representation. Mann Whitney Test reveals statistical significance, ***p < 0.001 (control n = 10, UAS-Alk n = 9). (F–G’’’) Immunofluorescence staining of Alk-expressing clones in wing imaginal discs dissected from wandering 3rd instar larvae. Discs were stained for Dcp-1, GFP and Alk. Scale bar = 50 µm in F. Scale bar = 10 µm in G’’. (H) Quantification of Dcp-1 positive cells in GFP control and Alk overexpressing wing discs. Bars depict means. Error bars represent S.D.; ***p < 0.001 (n = 7 wing discs). An unpaired, two-tailed t-test was applied to reveal significant differences. (I) Quantification of Dcp-1 positive cells in an 8–10 cell diameter surrounding GFP-control (n = 110) and Alk-overexpressing (n = 113) clones in the L3 wing discs. Means and SD (error bars) are depicted. Mann Whitney test was applied to reveal significant differences, ***p < 0.001. (J) Bee-swarm boxplot representation of the quantification of clone size of age-matched GFP-control (n = 16) and Alk-overexpressing (n = 19) clones in L3 wing discs. Mann Whitney test was applied to reveal significant differences, *p < 0.05.

