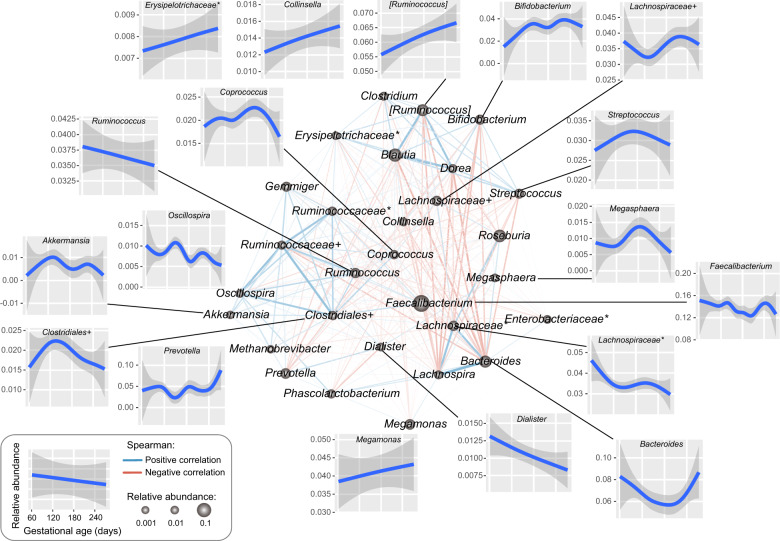
Fig. 2. Alterations of the core genera in pregnant women across pregnant stages.
The network consisted of significant positive (blue) and negative (red) correlations between 29 core genera with a mean relative abundance >0.5% (Spearman’s rank correlation coefficient test, q ≤ 0.05). Line width is proportional to the degree of correlation, and point size is proportional to the mean relative abundance of core genera in all samples. Outer graphs show the response pattern for the core genera across pregnant stages, and a smooth curve is formed based on the relative abundance of each genus and gestational days of the sample using the function geom_smooth with the default parameters in the R platform.

