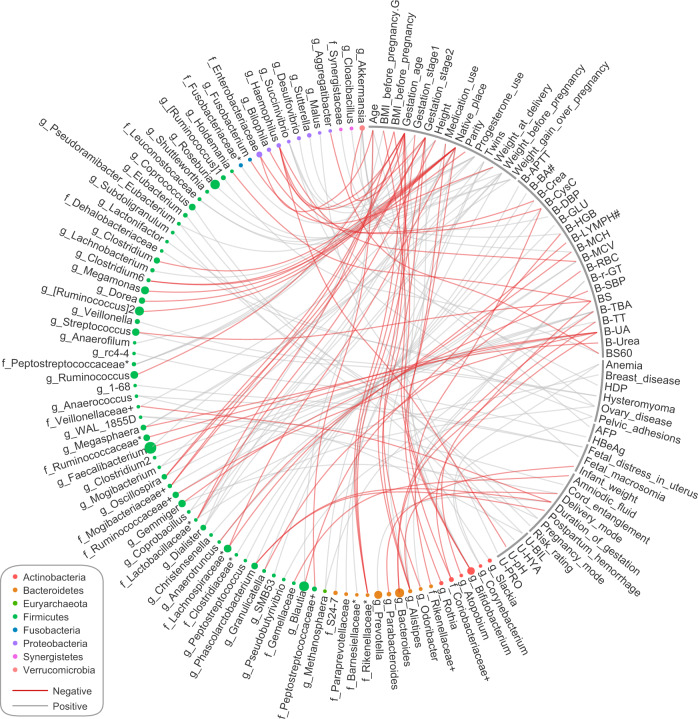
Fig. 4. A correlation network between bacterial genera and host parameters.
The network shows all significant correlations between genera and host parameters in the pregnant women (Spearman’s rank correlation coefficient test, q ≤ 0.05). The black lines and colored nodes on the ring represent host parameters and genera, respectively. Node size is proportional to the mean relative abundance of genera in all samples, and node color indicates phylum. Gray lines indicate positive correlation, and red lines indicate negative correlation.

