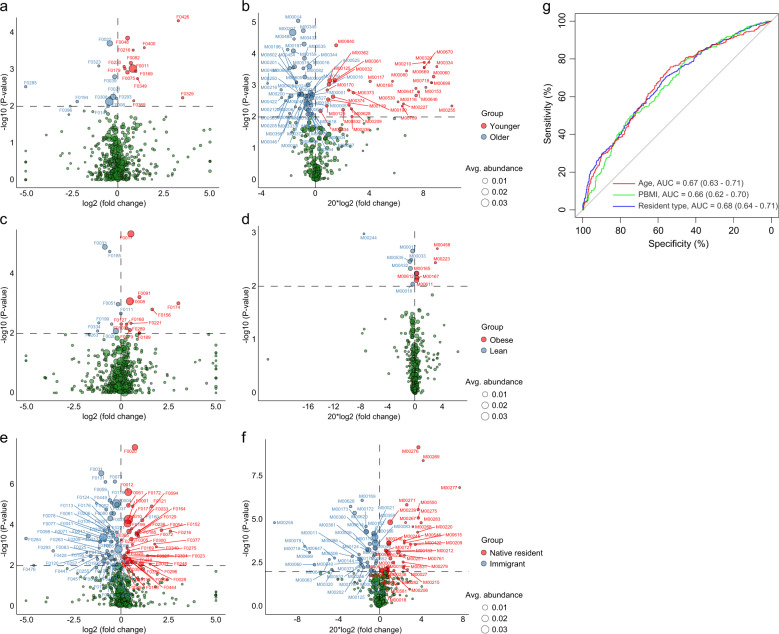
Fig. 5. Comparison of the gut microbial community compositions and functions among different groups.
a–f Comparison of the OTUs and KEGG modules (at level D) between younger and older (a, b), lean and obese (c, d), and native residents and immigrants (e, f) in the gut microbiota of pregnant women. Colored circles indicate OTUs or modules that were enriched in the corresponding group, and the sizes of the circles indicate their mean relative abundances. g Receiver operating curves for age, PBMI, and residency status. Random forest models based on significantly different OTUs were assessed with leave-one-out cross-validation.

