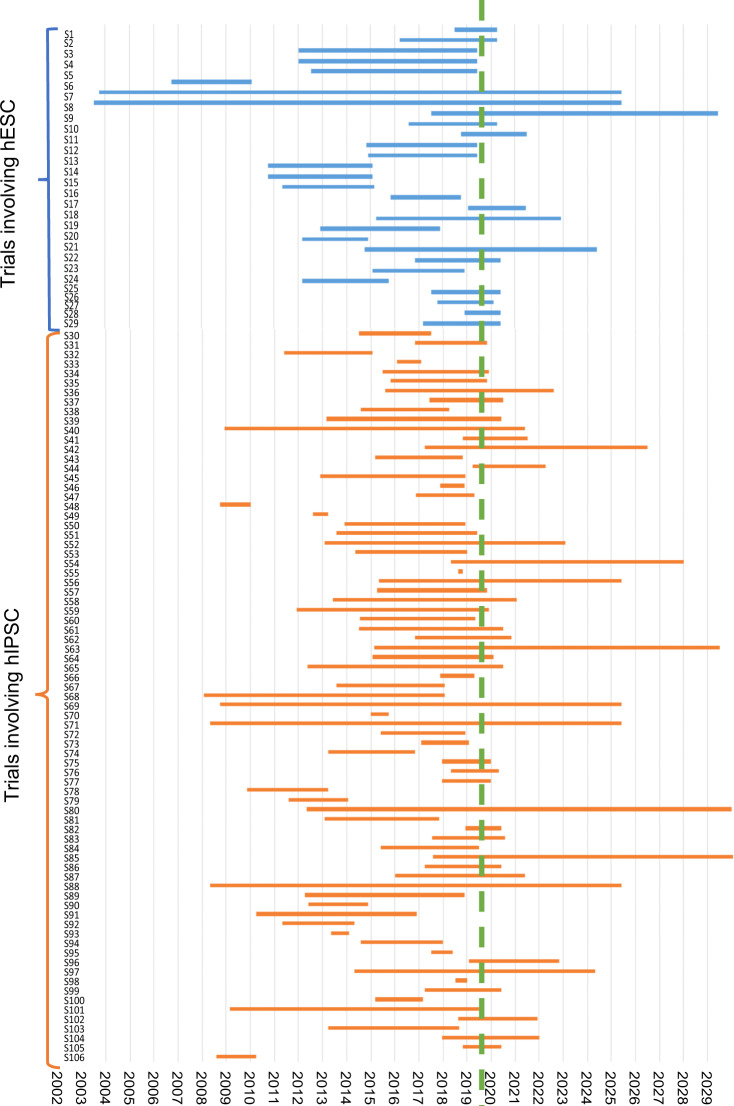
Fig. 3. Comparison of starting point and study duration dependent on the use of either one of the two stem cell types, hiPSC and hESC.
The blue bars show the starting point and study duration of clinical studies involving hESCs, the orange bars depict the same information for studies involving hiPSC. The green dashed line shows the time of data collection. The x axis shows the time in years, the y axis shows the study numbers. A list of the respective studies can be found in Supplementary Table 1.

