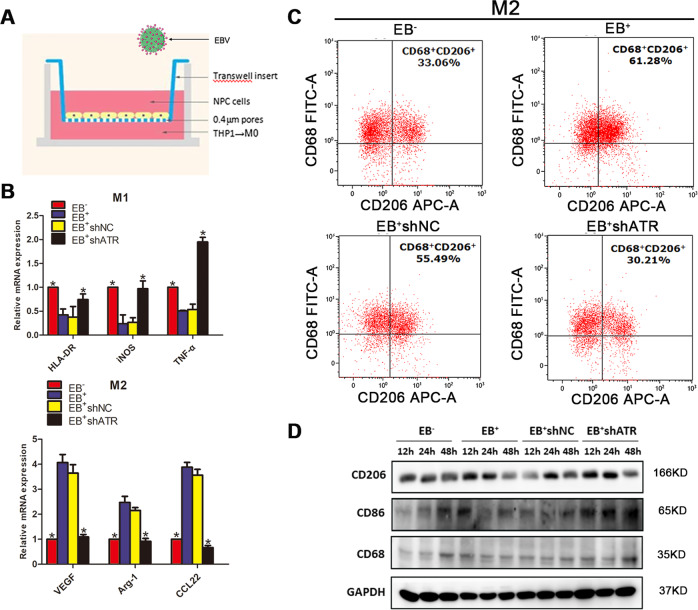
Fig. 2. ATR-promoted M2 polarization in EB+CNE1 cells.
a Schematic model of the co-culture system of macrophages and NPC cells; EB+CNE1 cells stably expressing shNC or shATR were co-cultured with M0 macrophages for 2 days, and EB− and EB+ were used as negative and positive controls, respectively. b qPCR determined mRNA levels of M1 and M2 macrophage markers; c Detection of the expression of CD68+/CD206+ by FCM. d WB detection of protein expression of CD68, CD86, and CD206 at different time points after co-culture. Data are represented as the mean ± SD of three independent experiments. *p < 0.05.

