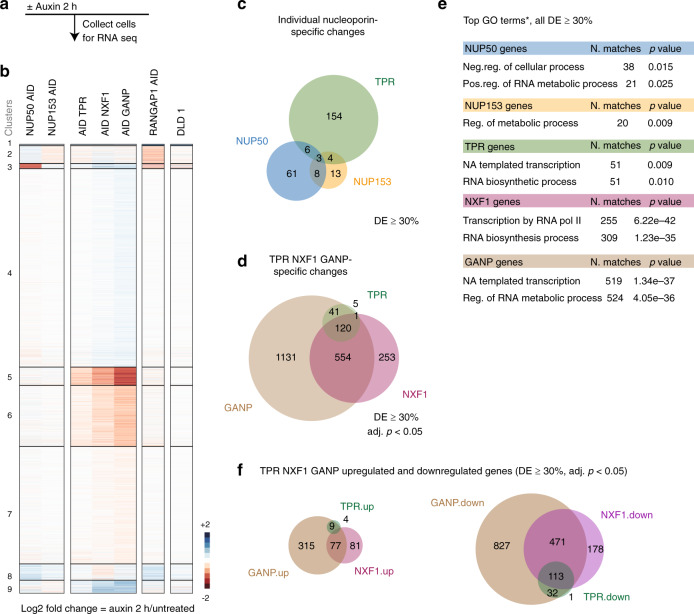
Fig. 2. Loss of TPR leads to rapid changes in mRNA abundance.
a, b A scheme of the experiment and heatmaps of unsupervised k-means clustering of differentially expressed genes 2 h after auxin treatment of cells expressing corresponding AID-tagged proteins. DLD-1 parental DLD-1 cells treated with auxin. Three independent biological replicates were used to perform RNA-seq of the indicated cell lines. c A Venn diagram representing the number of RNAs that showed significant change (both upregulation and downregulation) upon NUP50 (blue), NUP153 (yellow), and TPR (green) loss. d A Venn diagram representing the overlaps among significantly regulated transcripts upon TPR, NXF1 (purple), or GANP (brown) depletion (p value <2.3e−117, hypergeometric distribution test). e Top GO terms (*Biological Process, HumanMine v5.1 2018) of differentially expressed (DE) RNAs upon loss of the indicated nucleoporins (c), NXF1, and GANP (d). All DE RNAs (c, d) are log2FC > 30%, adj. p value <0.05, Wald test. f A Venn diagram representing the overlaps between significantly upregulated or downregulated transcripts upon TPR, NXF1, or GANP loss. Note that most of the TPR/NXF1/GANP-dependent RNAs are downregulated. Neg. negative, Pos. positive, Reg. regulation, NA Nucleic Acid, GO Gene Ontology, FC fold change.

