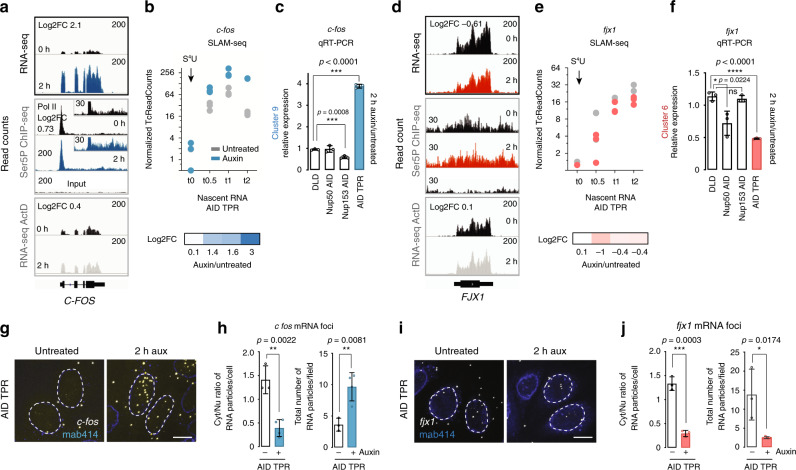
Fig. 6. TPR controls both transcription and RNA export.
a, e IGV snapshots of RNA-seq, Ser5P Pol II ChIP-seq, and ActD RNA-seq results for two representative transcripts c-fos (blue) and fjx1 (red). Log2FC is shown separately for each experiment. We performed three and two independent biological replicates for RNA-seq and ChIP-seq experiments, respectively. b, e Top: Normalized T > C count plots for c-fos and fjx1 transcripts. Three independent replicates are shown on the plot. Bottom: Log2FC of T > C counts of auxin treated vs. untreated sample at each time point from three independent biological replicates (Supplementary Data 5). c, f qRT-PCR analysis of c-fos and fjx1 RNA abundance 2 h after TPR, NUP50, or NUP153 loss. Graphs show mean values of three technical replicates of one experiment, error bars are SD. Asterisks indicate p value *<0.1, ***<0.001, ****<0.0001 (unpaired two-tailed Student’s t test), ns non-significant (p > 0.05). Exact p values are indicated on the graphs and in Source data file. g, i RNA-FISH analysis of localization of c-fos and fjx1 transcripts after 2 h of TPR loss. Note that both c-fos and fjx1 transcripts were retained within the nucleus. Data are representative of two independent experiments. h, j Quantification of cytoplasmic to nucleus (Cyt/Nu) ratio and total number of mRNA foci after TPR loss. Data are presented as mean values, error bars are SD. Asterisks indicate p value *<0.1, **<0.01, ***<0.001 (unpaired two-tailed Student’s t test). Three independent fields from two independent experiments were used for c-fos (untreated cells, n = 51; auxin-treated cells, n = 69 for AID-TPR cell line) and fjx1 (untreated cells, n = 30, auxin-treated cells, n = 50) mRNA foci quantification. Exact p values are indicated on the graphs and in Source data file. FC fold change.

