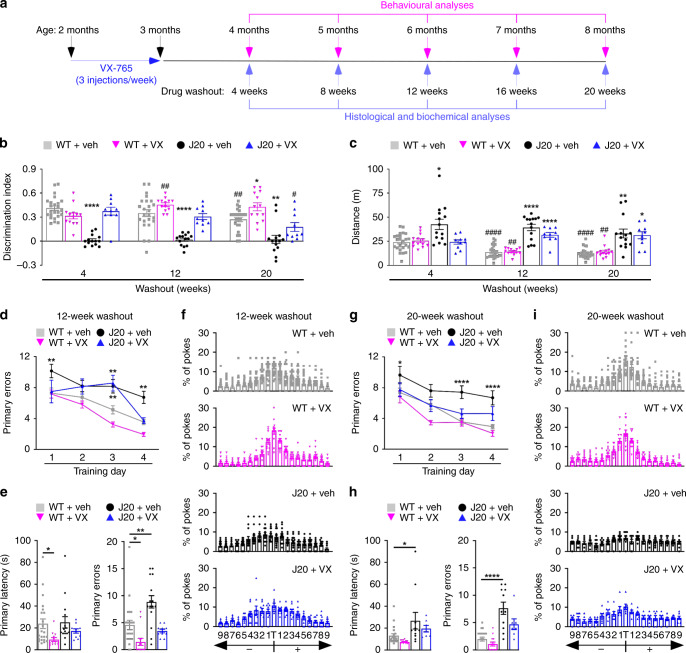
Fig. 2. Pre-symptomatic VX-765 treatment delays cognitive deficits in J20 mice.
a Schematic diagram showing treatment and behavioural assessment. b NOR discrimination index of repeatedly tested vehicle-treated WT (□, n = 24), VX-765-treated WT (▽, n = 13), vehicle-treated J20 (●, n = 14) and VX-765-treated J20 (△, n = 10) mice at 4-, 12- and 20-week WO [treatment F(3,57) = 49.53, p = 1.0 × 10⁻¹⁵; treatment × WO interaction F(6,114) = 3.576, p = 0.0028, repeated-measures two-way ANOVA, Bonferroni’s post hoc compared to same treatment group at 4-week WO (#) or Dunnett’s post hoc comparing different treatment groups to WT + vehicle within same WO (*)]. c Open-field distance travelled of vehicle-treated WT (n = 24), VX-765-treated WT (n = 13), vehicle-treated J20 (n = 14) and VX-765-treated J20 (n = 10) mice [treatment F(3,57) = 33.38, p = 1.38 × 10⁻¹²; WO F(2,110) = 6.856, p = 0.0018; treatment × WO interaction F(6,114) = 3.801, p = 0.0017, repeated-measures two-way ANOVA, Bonferroni’s post hoc compared to same treatment group at 4-week WO (#) or Dunnett’s post hoc comparing different treatment groups to WT + vehicle within same WO (*)]. d–f Barnes maze analyses of vehicle-treated WT (n = 22), VX-765-treated WT (n = 13), vehicle-treated J20 (n = 15) and VX-765-treated J20 (n = 10) mice at 12-week WO. d Learning acquisition primary errors [treatment F(3,219) = 20.58, p = 8.74 × 10⁻¹²; training day F(3,219) = 22.94, p = 5.94 × 10⁻¹³, two-way ANOVA, Dunnett’s post hoc compared to WT + vehicle], e probe primary latency and primary errors [primary errors F(3,56) = 11.01, p = 8.76 × 10⁻⁶, ANOVA, Dunnett’s post hoc compared to WT + vehicle], and f percentage of pokes for each hole during probe, where T indicates target hole. g–i Barnes maze analyses of vehicle-treated WT (n = 20), VX-765-treated WT (n = 13), vehicle-treated J20 (n = 11), VX-765-treated J20 (n = 8)] mice re-tested at 20-week WO. g Learning acquisition primary errors [treatment F(3,198) = 24.05, p = 2.57 × 10⁻¹³; training day F(3,198) = 23.69, p = 3.82 × 10⁻¹³, two-way ANOVA, Dunnett’s post hoc compared to WT + vehicle]. h Probe primary latency and primary errors [primary latency F(3,47) = 4.850, p = 0.0051; primary errors F(3,47) = 19.75, p = 2.0 × 10⁻⁸, ANOVA, Dunnett’s post hoc compared to WT + vehicle], and i percentage of pokes during the probe. Data represents mean and s.e.m. Each symbol represents one mouse. *p < 0.05, **p < 0.01, ***p < 0.001, ****p < 0.0001 for all panels; #p < 0.05, ##p < 0.01, ####p < 0.0001 for panels (b) and (c).

