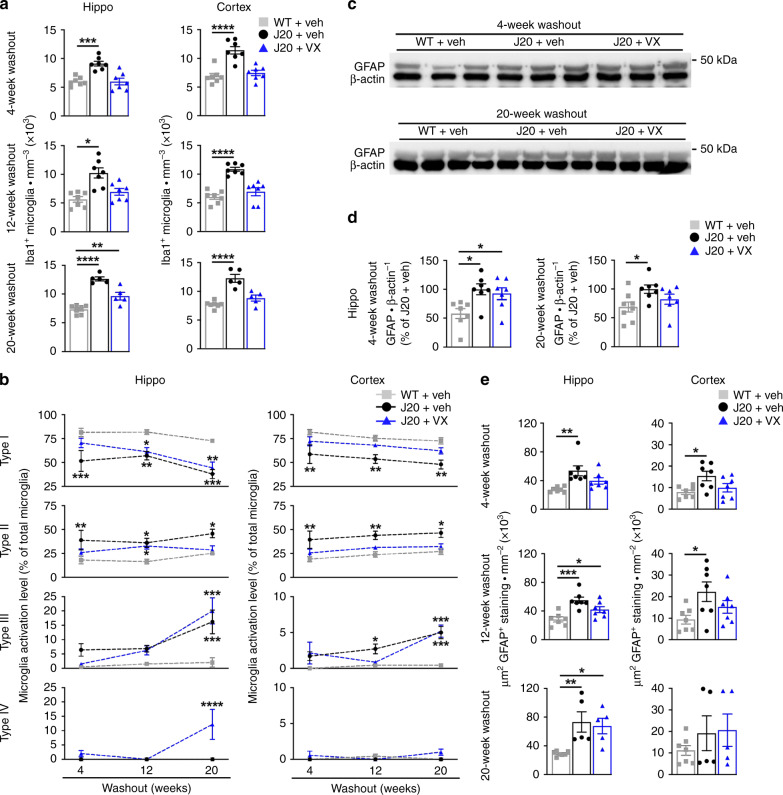
Fig. 4. Pre-symptomatic VX-765 treatment decreases Iba1-positive microglial inflammation in J20 mice.
a Iba1-positive microglial quantification of vehicle-treated WT and J20, and VX-765-treated J20 mice from the pyramidal cell layer to the SLM in the hippocampal CA1 [hippo 4-week WO F(2,18) = 16.42, p = 8.74 × 10⁻⁵; hippo 12-week WO F(2,18) = 12.25, p = 0.0004; hippo 20-week WO F(2,14]) = 40.35, p = 1.54 × 10⁻⁶] and cortical retrosplenial and S1 area [cortex 4-week WO F(2,18) = 20.53, p = 2.27 × 10⁻⁵; cortex 12-week WO F(2,18) = 25.82, p = 5.14 × 10⁻⁶; cortex 20-week WO F(2,14) = 25.92, p = 1.96 × 10⁻⁵, ANOVA, Dunnett’s post hoc compared to WT + vehicle]. b Mean percentage distribution of morphological microglial subtype I [hippo treatment interaction F(2,50) = 22.47, p = 1.09 × 10⁻⁷; across WO F(2,50) = 7.044, p = 0.0020; cortex treatment interaction F(2,50) = 16.96, p = 2.38 × 10⁻⁶], subtype II [hippo treatment F(2,50) = 12.37, p = 4.31 × 10⁻⁵; cortex treatment F(2,50) = 14.66, p = 9.78 × 10⁻⁶], subtype III [hippo treatment F(2,50) = 18.04, p = 1.26 × 10⁻⁶; WO F(2,50) = 19.50, p = 5.49 × 10⁻⁷; treatment × WO interaction F(4,50) = 5.098, p = 0.0016; cortex treatment F(2,50) = 14.37, p = 1.18 × 10⁻⁵; WO F(2,50) = 8.890, p = 0.005, treatment × WO interaction F(4,50) = 2.822, p=0.0346, two-way ANOVA, Dunnett’s post hoc compared to WT + vehicle], and subtype IV (no significant difference). In (a) and (b), n = 7 mice per group at 4-week WO; n = 7 mice per group at 12-week WO; n = 7 WT + veh, 5 J20 + veh, 5 J20 + VX, mice at 20-week WO. c GFAP and β-actin western blot in the hippocampus of three independent mice at 4- and 20-week WO. d GFAP western blot quantification in the hippocampus at 4-week (n = 7 mice per group) and 20-week (n = 8 WT + veh, 7 J20 + veh, 7 J20 + VX mice). WO: [4-week WO F(2,18) = 5.577, p = 0.0130; 20-week WO F(2,19) = 3.629, p = 0.0463, ANOVA, Dunnett’s post hoc compared to WT + vehicle]. e GFAP positive immunostaining density in the hippocampal CA1 and retrosplenial and S1 cortex [hippo 4-week WO F(2,18) = 7.546, p = 0.0042; cortex 4-week WO F(2,18) = 4.571, p = 0.0248; hippo 12-week WO F(2,18) = 11.66, p = 0.0006; cortex 12-week WO F(2,18) = 3.723, p = 0.0443; hippo 20-week WO F(2,14) = 7.763, p = 0.0054, ANOVA, Dunnett’s post hoc compare to WT + vehicle]. Mouse numbers in (e) are the same as in (a). Data represents mean and s.e.m. *p < 0.05, **p < 0.01, ***p < 0.001, ****p < 0.0001.

