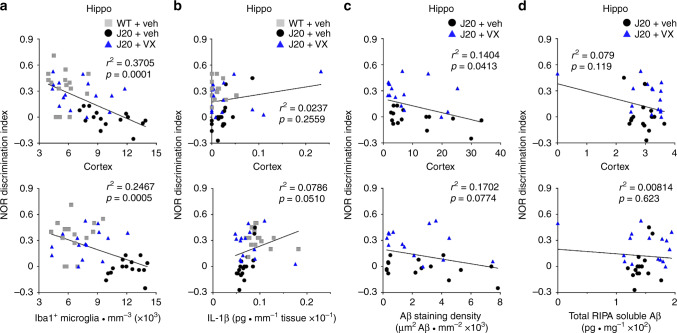
Fig. 7. Microglial activation, not Aβ, leads to cognitive deficits in J20 mice.
a–d Scatter plot and linear regression analyses of all behaviourally-tested WT and J20 mice comparing NOR discrimination index to a Iba1-positive microglial numbers (hippo r2 = 0.3705, cortex r2 = 0.2467), b ELISA-measured IL-1β (hippo r2 = 0.0237, cortex r2 = 0.0786), c Aβ staining density (hippo r2 = 0.1404, cortex r2 = 0.1702) and d RIPA-soluble total Aβ (hippo r2 = 0.079, cortex r2 = 0.00814). In (a), n = 15 mice per group, (b) n = 17 WT + Veh, 16 J20 + Veh and 16 J20 + VX mice, (c) n = 15 J20 + Veh and 15 J20 + VX mice, (d) n = 16 mice per group.

