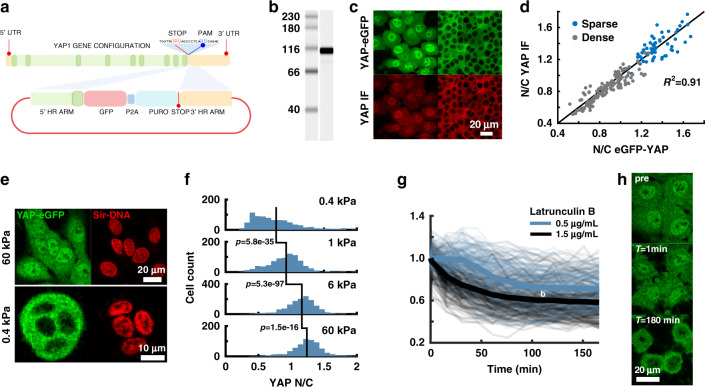
Fig. 1. Characterization of YAP and TEAD genome-knockin cell lines.
a Cartoon of CRISPR-Cas9 based insertion of eGFP-P2A-puromycin cassette at 3′ end of the YAP gene. b western blot against eGFP from MCF10AYAP-GFP-KI whole cell lysate. Single predominant band at the predicted YAP-eGFP fusion size 96 kDa. Repeated twice with similar results. c Correlation of the YAP nuclear/cytoplasmic ratio (N/C) signal for YAP-eGFP and anti-YAP immunofluorescence in sparse and dense cultures. Nsparse = 61 cells, Ndense = 155 cells from one experiment. Repeated twice with similar results. d Representative Immunofluorescence images of data from c. e MCF10AYAP-GFP-KI cells plated on soft (0.4 kPa) and stiff (60 kPa) acrylamide showing altered cell morphology and YAP localization. Cells were counterstained with the live-cell nuclear stain, SiR-DNA™. f Quantitative comparison of YAP-eGFP N/C on fibronectin coated acrylamide of varying stiffnesses. N0.4 kPa = 834, N1 kPa = 818, N6 kPa = 1386, N60 kPa = 647 cells. A one-sided Mann–Whitney U-test was used to test differences in YAP N/C. 0.4 kPa vs. 1 kPa: 5.8 × 10⁻³⁵, Ranksum = 570,253. 1 kPa vs. 6 kPa: p = 5.3 × 10−97, Ranksum = 600,652. 6 kPa vs. 60 kPa: P = 1.452 × 10⁻¹⁶, Ranksum = 1,308,747. Data compiled from two independent experiments for each condition. g Time-course of YAP N/C normalized to initial value following Latrunculin B treatment at 0.5 µg/mL (140 cell traces) and 1.5 µg/mL (256 cell traces). Individual cell traces in transparent lines with mean plotted as solid line. Data compiled from one independent experiment for each condition. h Fluorescent images of YAP-eGFP before and after Latrunculin B treatment for the indicated times.

