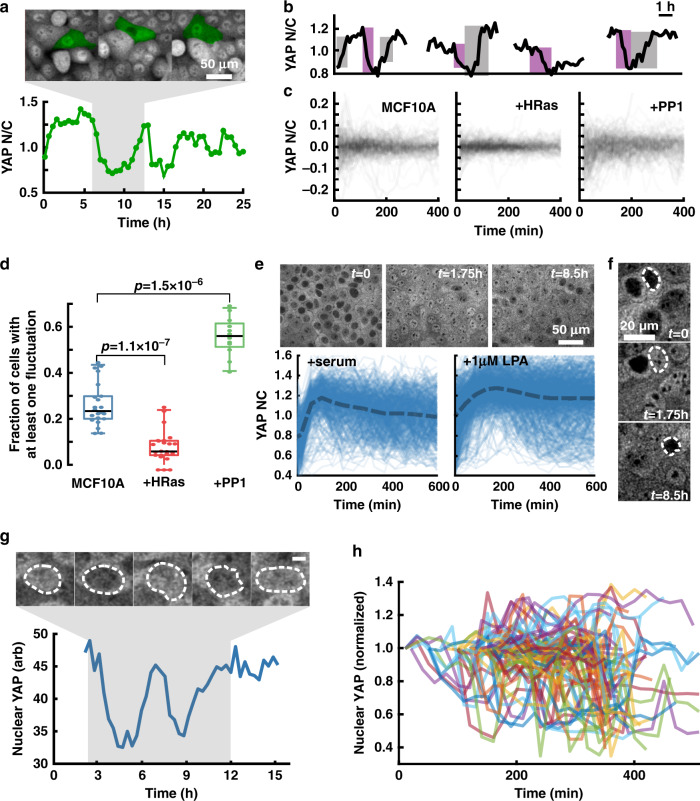
Fig. 3. Baseline (minute-scale) fluctuations in YAP localization.
a N/C trace of an individual MCF10A cell in monolayer and corresponding fluorescence image (cell of interest is false colored in green). b Example traces of YAP N/C over time with large changes in signal highlighted by gray (increase) and purple (decrease) in MCF10A cells. c Overlay of YAP N/C traces for MCF10A, MCF10A + HRas, and MCF10A + 1 μM PP1. Each plot contains 200 traces randomly selected from the pool of all tracks collected from each condition. The mean N/C value is subtracted from each trace to allow visual comparison. d Mean fraction of cells with at least one detectable fluctuation within a 24 h time-course (24 ROIs for each condition compiled from two independent experiments). Box and whisker lines: black-center line is median value, box-bounds are 25th and 75th percentile, and whiskers are 0.05 and 0.95 percentiles. A one-sided Mann–Whitney U-test was used to test whether the fraction of cells displaying a significant fluctuation was changed after HRas expression (N = 24, P = 9.0 × 10⁻⁷, Ranksum-Stat = 734) or PP1-treatment (N = 24, P = 3.52 × 10⁻⁴, Ranksum-Stat = 290.5). e (Top panel) Time-course of MCF10AYAP-GFP-KI cells following 20 h serum starvation followed by serum replenishment. (Bottom panel) Quantification of YAP N/C following stimulation by serum or 1 µM LPA stimulation. f Fluorescent images of serum starved cells followed by serum stimulation for the indicated times. g Fluctuation of nuclear YAP in a single representative H1 hESCYAP-GFP-KI cell. (Top panel) Nuclear outline highlighted in dashed line. (bottom panel) Quantification of nuclear YAP intensity over time. At very high density in hESCYAP-GFP-KI cells it is not feasible to reliably estimate cytoplasmic intensity. h Overlay of nuclear YAP intensity in many individual hESCYAP-GFP-KI cells showing dynamic changes in intensity levels. Repeated twice with similar results.

