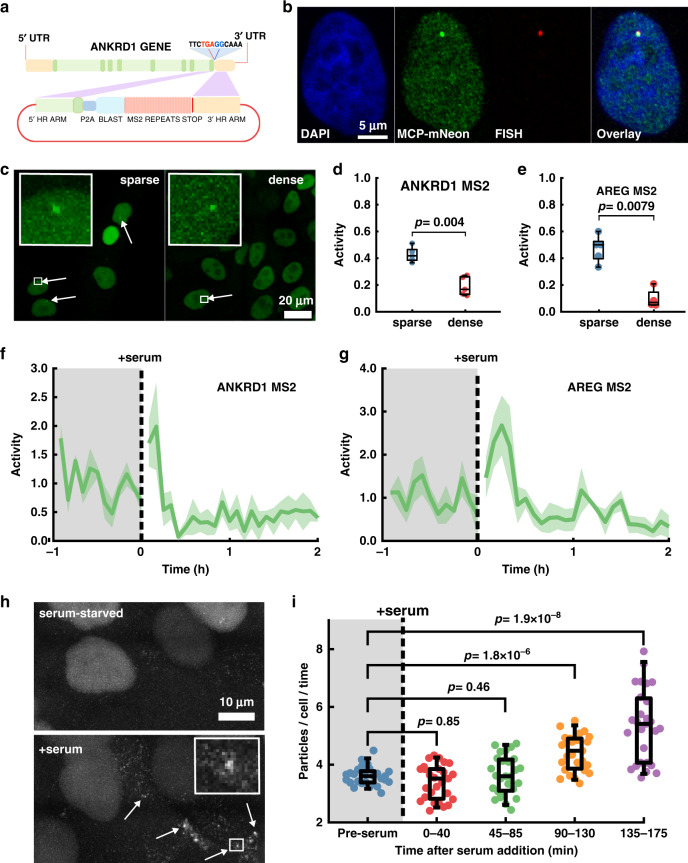
Fig. 5. Transcription dynamics of YAP target genes.
a Cartoon showing strategy for knocking in an MS2 transcription reporter cassette at the end of the coding sequence of ANKRD1 gene. b Representative image of MCF10AAREG-MS2-KI cells co-expressing MCP-mNeon with Quasar® 670-labeled RNA FISH probes against native AREG transcript. Repeated twice with consistent co-localization. c Representative images of sparse and dense cultures of MCF10AAREG-MS2-KI showing nascent transcription spots. d, e Quantification of nascent transcription spots in sparse and dense MCF10AAREG-MS2-KI and MCF10AANKRD1-MS2-KI cells. Transcription activity is the fraction of cells with a detectable transcribing locus. A one-sided Mann–Whitney U-test was used to test for differences in activity. d ANKRD1: P = 0.004, ranksum = 40. N = 5 ROI’s from two independent samples per condition. e AREG: P = 0.0079, ranksum = 35. N = 5 ROI’s from two independent samples per condition. Box and whisker lines: black-center line is median value, box-bounds are 25th and 75th percentiles, and whiskers are 0.05 and 0.95 percentiles. f, g Transcription activity of MCF10AANKRD1-MS2-KI f and MCF10AAREG-MS2-KI g cell lines in serum starved cultures before and after serum stimulation. Solid line is mean of three independent experiments, shaded line is SEM. h Representative time-lapse projection of 10-frames before serum-starvation and 10-frames after 2 h of serum stimulation of MCF10AANKRD1-MS2-KI cells i Quantification of the number of cytoplasmic and membrane localized ANKRD1 transcripts per cell before serum, and at various time points over a 3-h period post serum stimulation. Data for each condition was collected over a time window of 40 min, with individual data points representing the mean number of transcripts per cell for each image acquisition. A one-sided Mann–Whitney U-test was used to test differences in transcript counts. Preserum vs. [0–40 min]: P = 0.85, Ranksum = 803. Preserum vs. [45–85 min]: P = 0.46, Ranksum = 736. Preserum vs. [90–130 min]: P = 1.77 × 10⁻⁶, Ranksum = 474. Preserum vs. [135–175 min]: P = 1.88 × 10⁻⁸, Ranksum = 424. N = 27 for each condition. Data compiled from the three independent experiments in f. Box and whisker lines: black-center line is median value, box-bounds are 25th and 75th percentiles, and whiskers are 0.05 and 0.95 percentiles.

