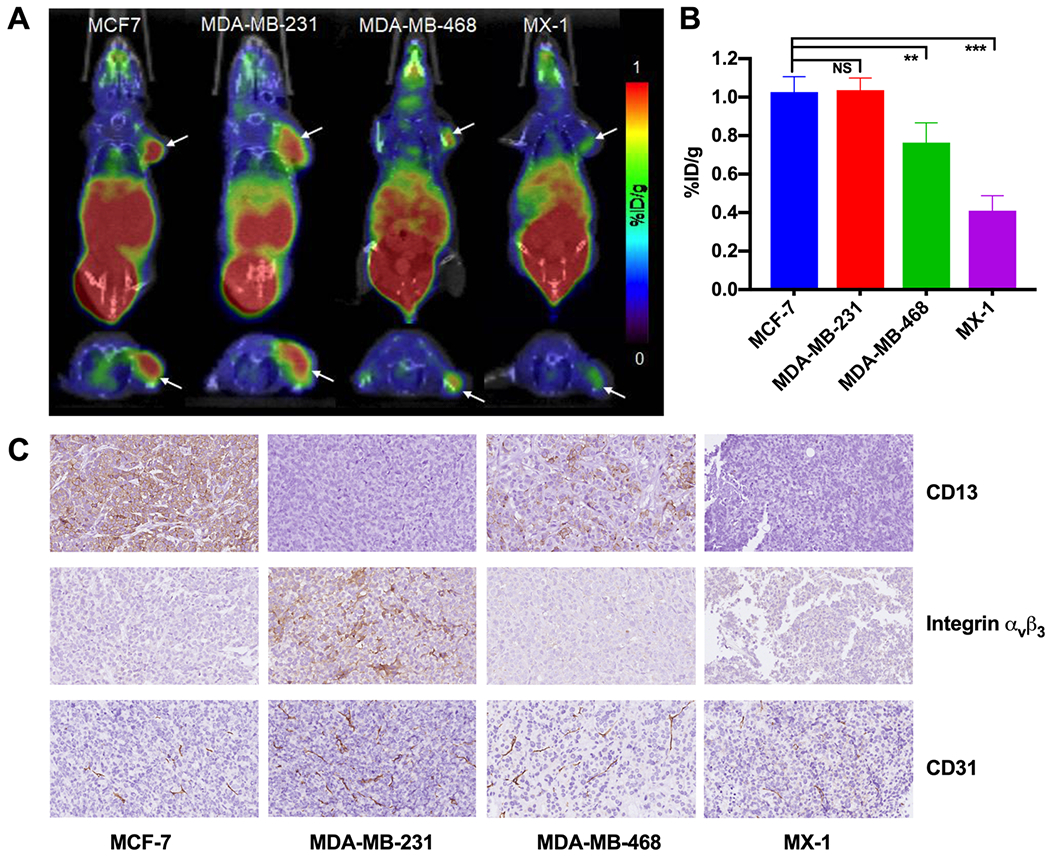
Figure 5.

(A) Representative static PET/CT images of MCF-7, MDA-MB-231, MDA-MB-468, and MX-1 tumor xenograft mice at 30 min p.i. of 68Ga-NGR-RGD (6.5–9 MBq). (B) Tumor uptakes determined by quantitative analysis of PET/CT images. (C) Immunohistochemistry assay of CD13, integrin αvβ3, and CD31 in MCF-7, MDA-MB-231, MDA-MB-468, and MX-1 tumors (400 ×). Arrows indicate the location of tumors (n = 4 each group).
