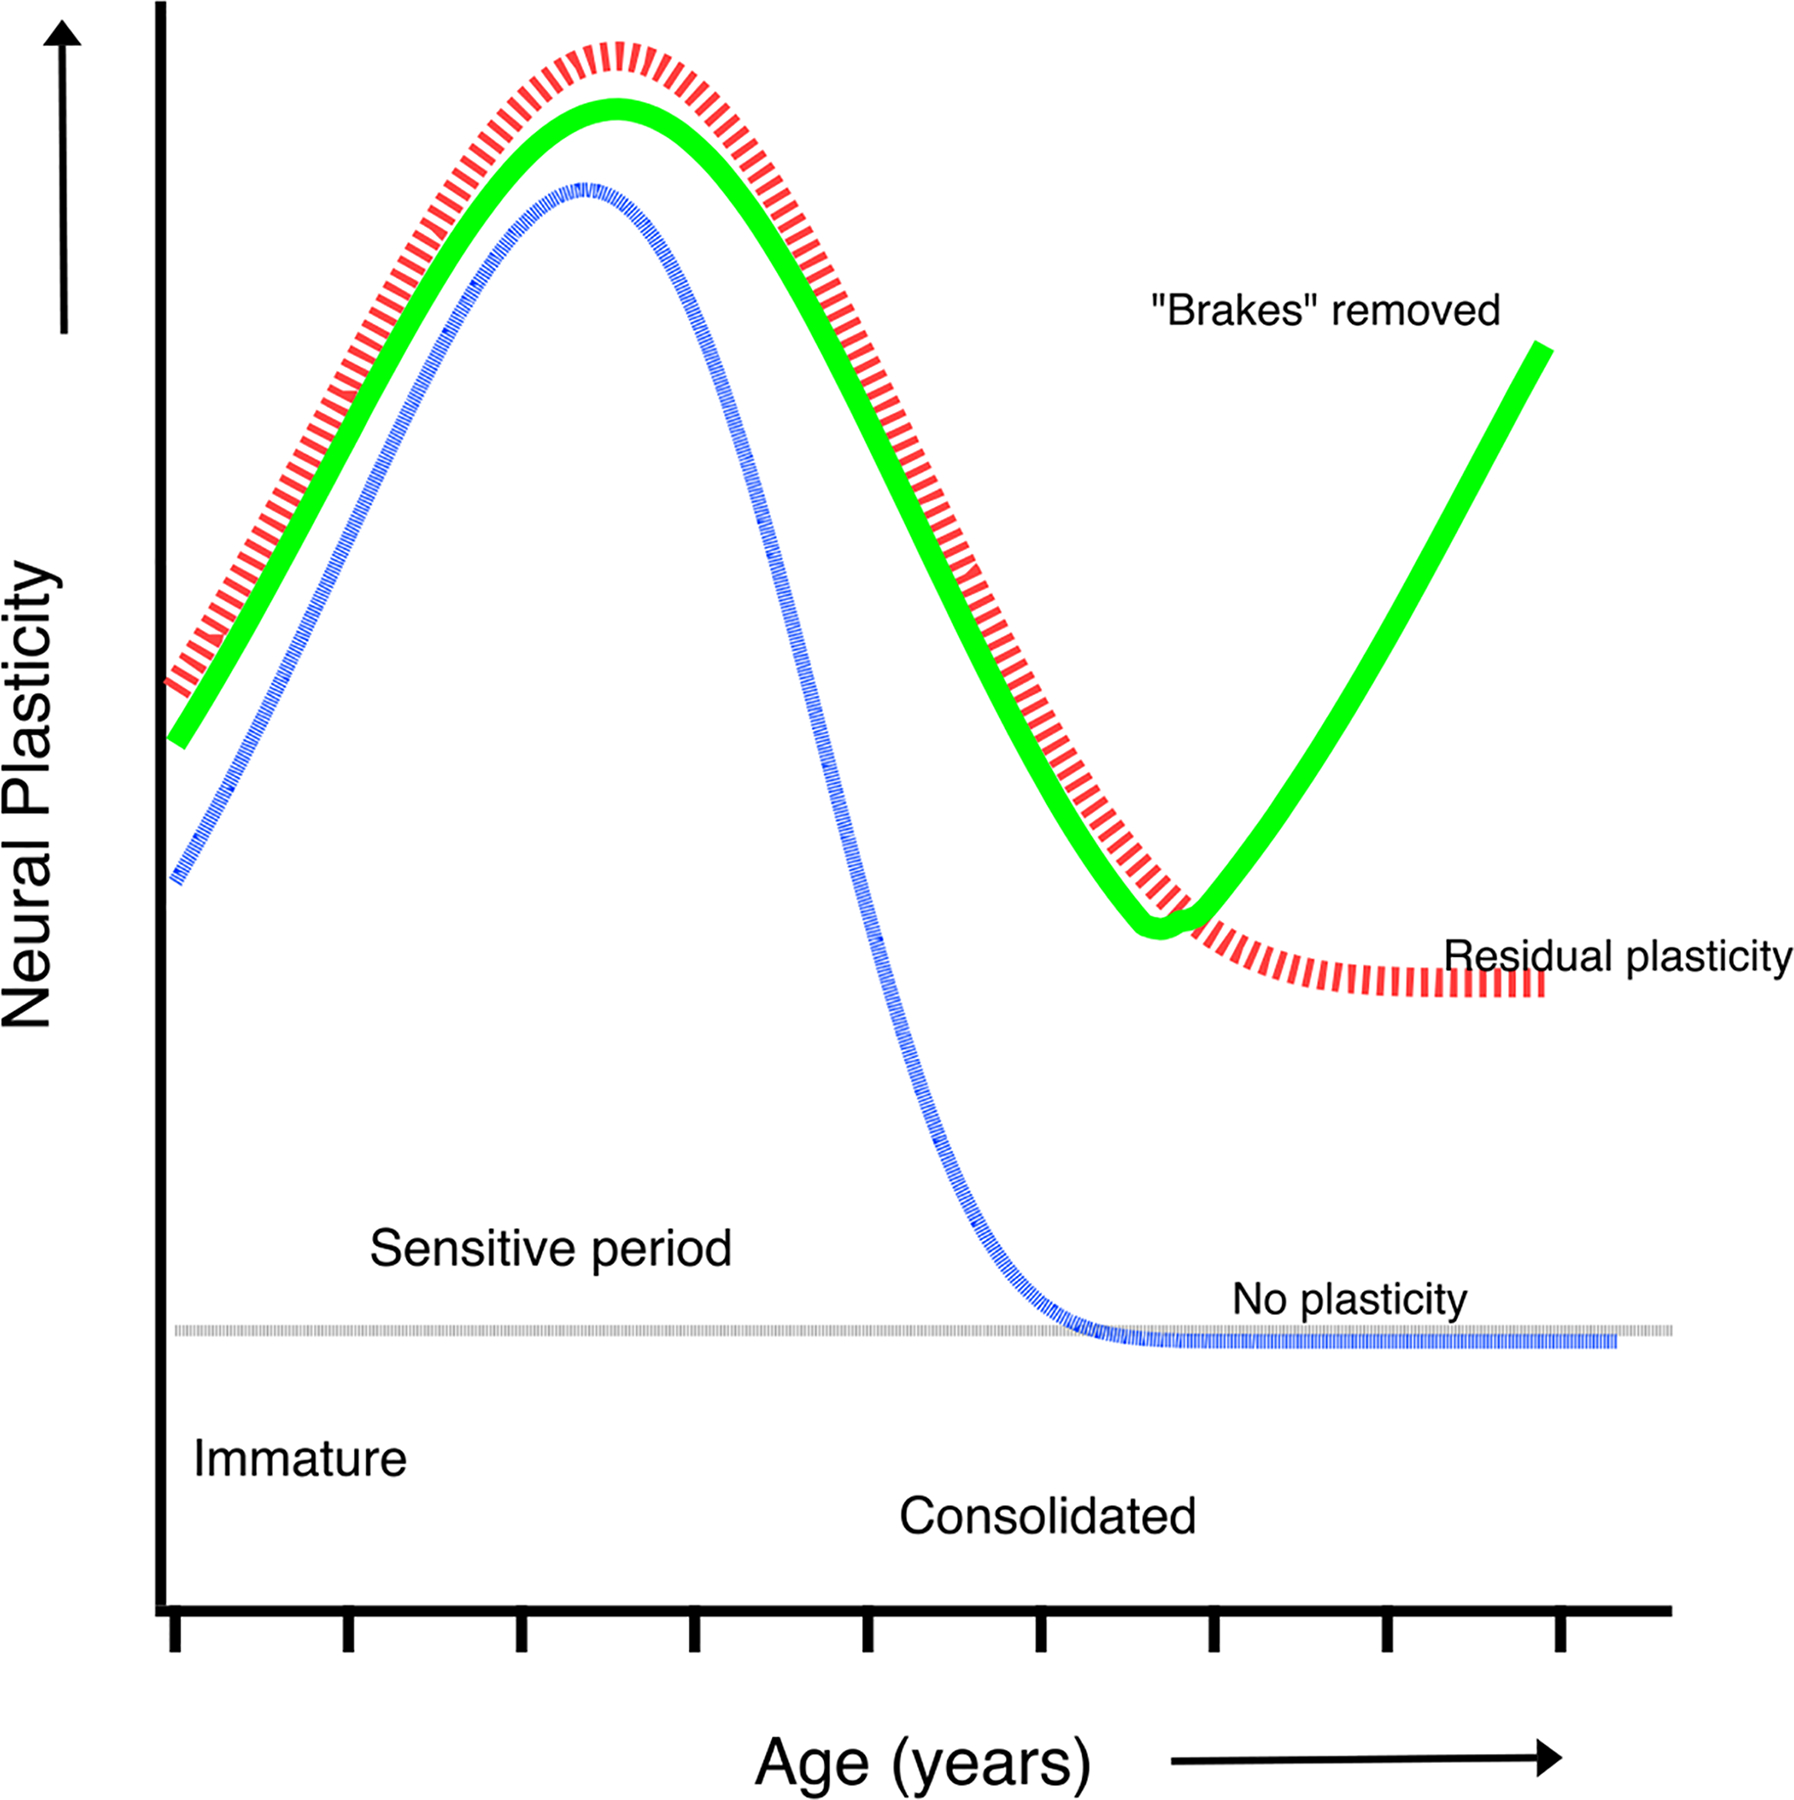
Fig. 2. The sensitive period.

This cartoon illustrates several hypotheses regarding neural plasticity during development. The blue curve shows plasticity increasing during early development when the neural system is immature, peaking and rapidly diminishing to zero when function is consolidated. The red curve is similar, but with residual plasticity extending into adulthood. The green curve illustrates removal of the factors (brakes) that limit plasticity and restore levels of neural plasticity in adults.
