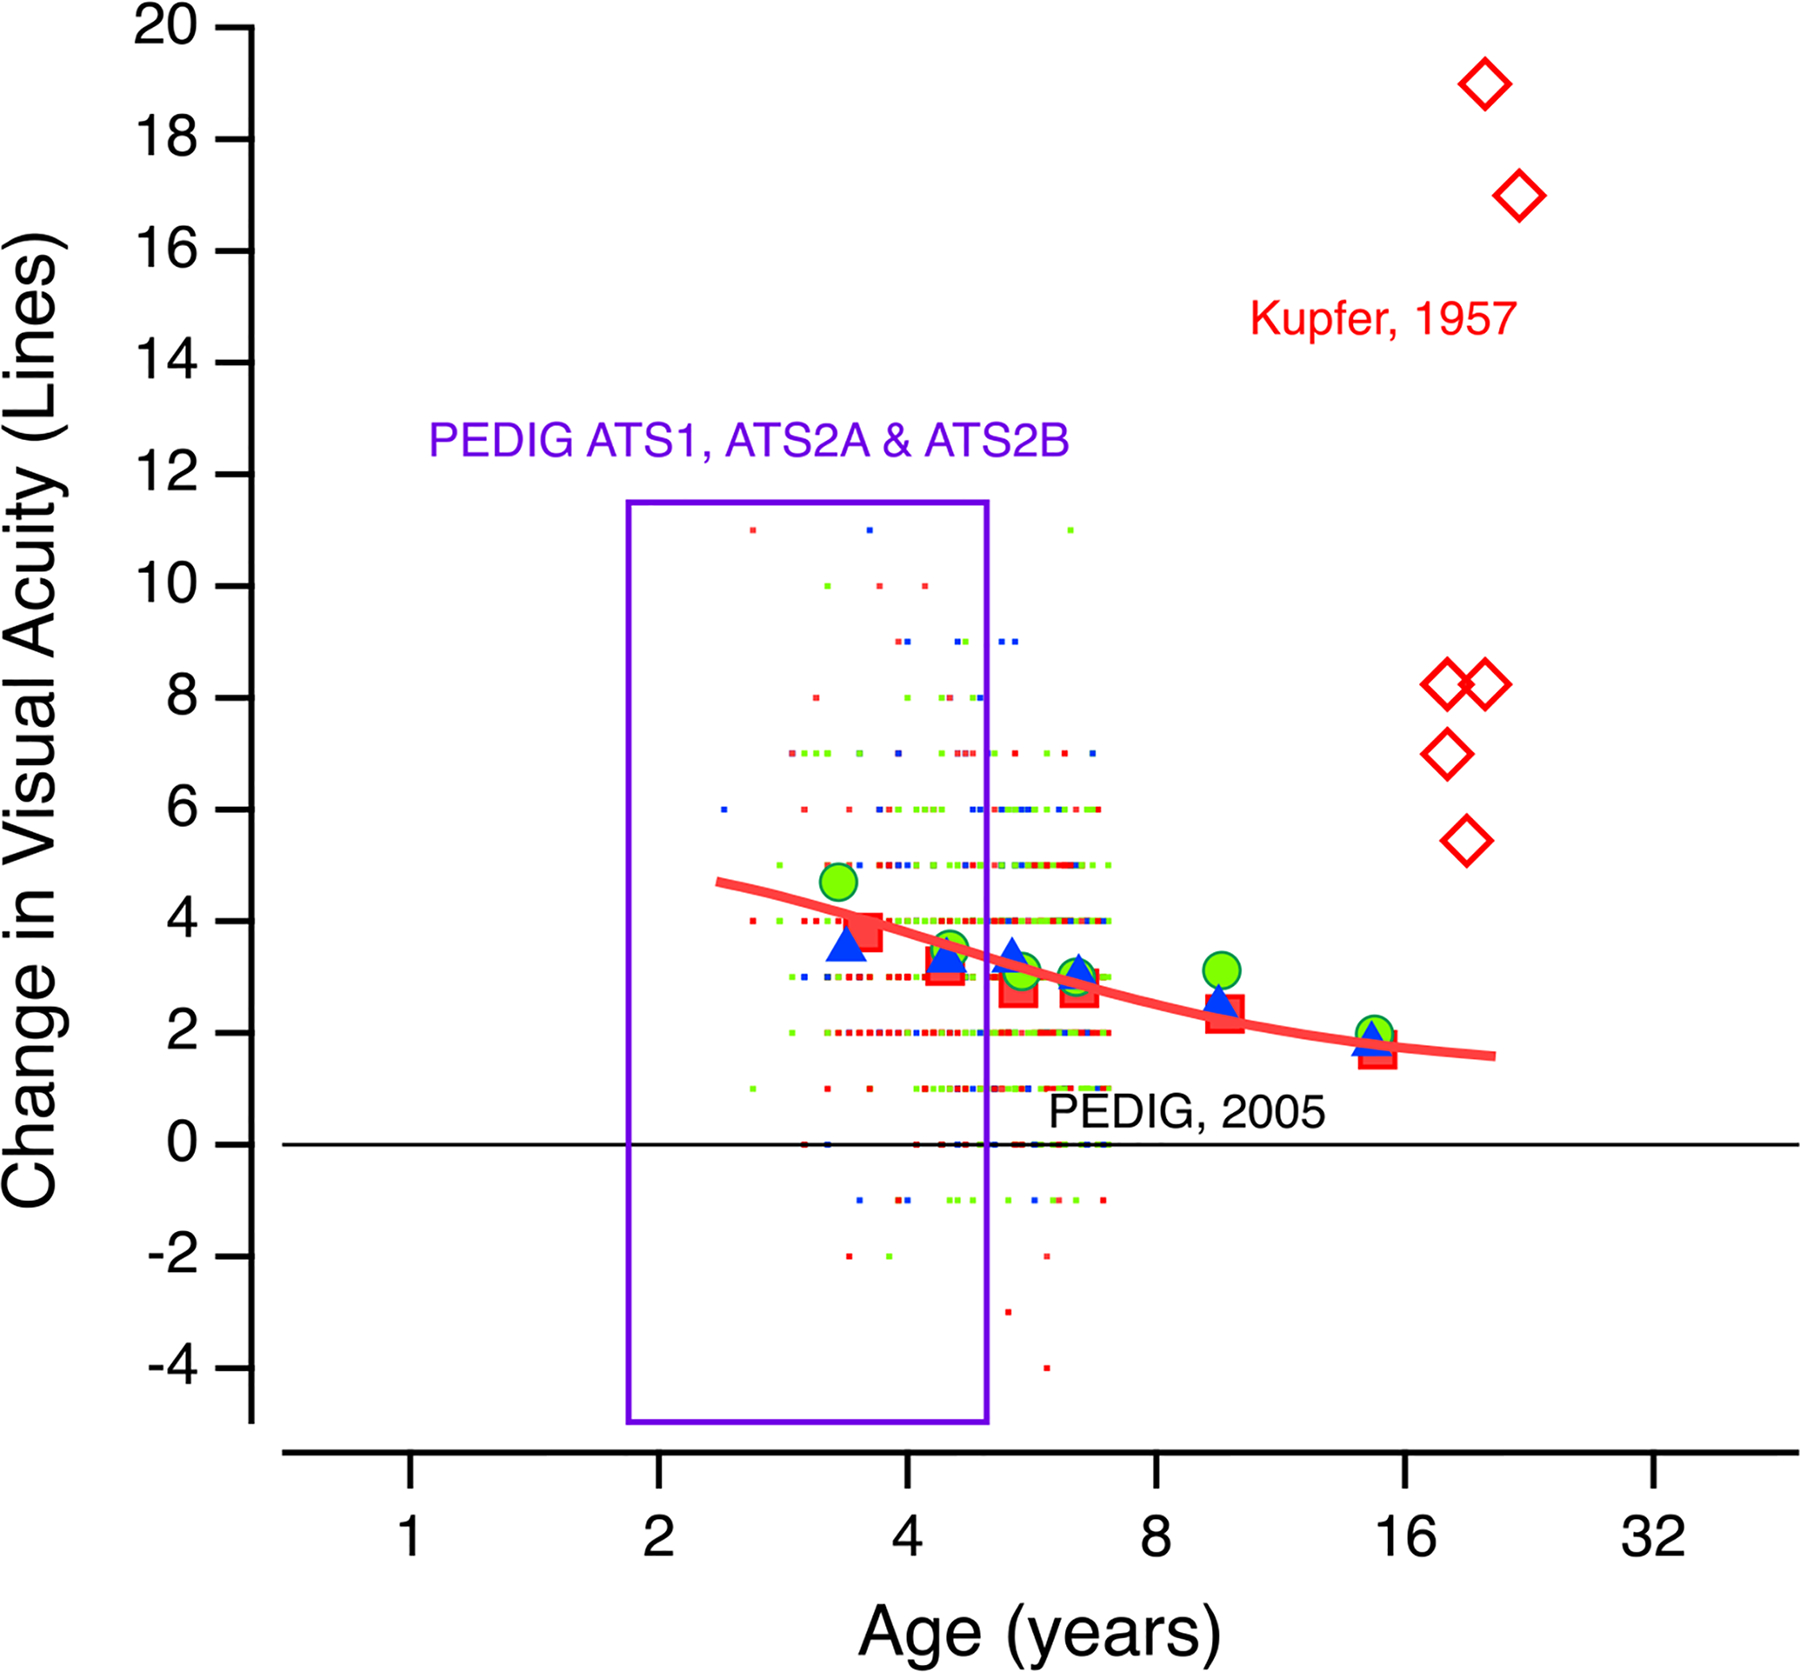
Fig. 3. Change in visual acuity vs. Age of Treatment.

Summary of 3 clinical trials: Trial ATS1 compared daily atropine to occlusion for at least 6 hours/day; trial ATS2A compared 6 hours/day versus full-time patching for severe amblyopia and trial ATS2B compared 6 hours versus 2 hours/day of patching in patients with moderate amblyopia. The tiny dots are the individual data from ≈ 800 patients; the large symbols show the mean idata in ≈ 1 year bins; included also are the mean data from an additional study (PEDIG 2005) that examined the effectiveness of treatment in children ages 7 to 17. A positive change in acuity is improvement. (after Holmes and Levi, 2018). Also shown here (red diamonds) are data from a small group of adult amblyopes who underwent intensive treatment (see text) from Kupfer, 1957. The red line is a fit to the mean PEDIG data.
