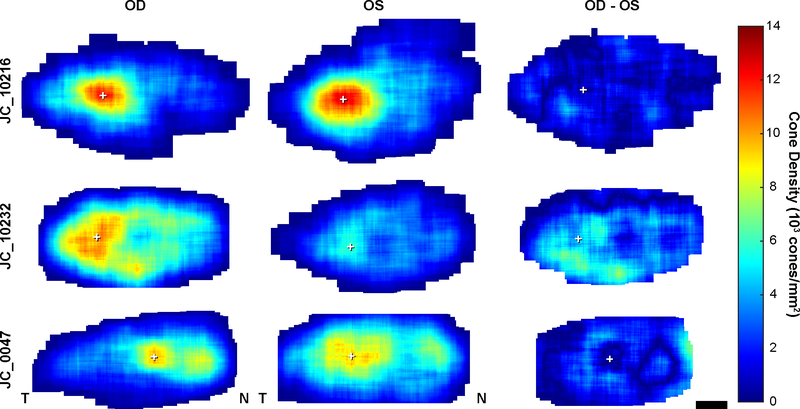
Figure 5.
Foveal cone photoreceptor topography in ACHM. Density maps showing cone density at every pixel within the rod-free zone in the right and left eyes of three subjects (OD and OS, first and second columns respectively). Data from the left eye is flipped to match the same nasal-temporal orientation as the right eye. Difference maps (third column) show absolute difference between right and left eyes of a subject. JC_10216 is an example of good interocular symmetry by peak cone density (PCD) and JC_10232 had the worst interocular symmetry by PCD as shown in figure 2. JC_0047 shows an example of multiple areas of relatively high cone density within the rod-free zone. White cross, location of PCD. Scale bar, 100 μm.

